While looking over the 215 or so new packages that made it to CRAN in May, I was delighted to find several packages devoted to subjects a little bit out of the ordinary; for instance, bioacoustics analyzes audio recordings, freegroup looks at some abstract mathematics, RQEntangle computes quantum entanglement, stemmatology analyzes textual musical traditions, and treedater estimates clock rates for evolutionary models. I take this as evidence that R is expanding beyond its traditional strongholds of statistics and finance as people in other fields with serious analytic and computational requirements become familiar with the language. And, when I see a package from a philologist and scholar of “Ancient and Medieval Worlds”, I am persuaded to think that R is making a unique contribution to computational literacy.
Below are my “Top 40” package picks for May 2018, organized into the following categories: Computational Methods, Data, Data Science, Finance, Mathematics, Music, Science, Statistics, Time Series, Utilities and Visualization.
Computational Methods
dqrng v0.0.4: Provides fast random number generators with good statistical properties, including the 64-bit variant of the Mersenne-Twister, pcg64, and Xoroshiro128 and Xoroshiro256. There is an Introduction and a vignette on Parallel Usage.
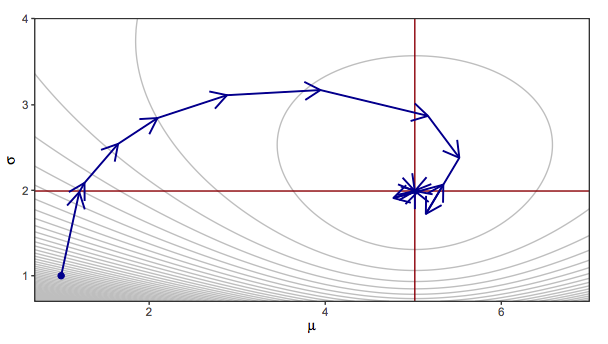
optimParallel v.7-2: Provides a parallel versions of the gradient-based stats::optim() function. The vignette is informative.
Data
childesr v0.1.0: Implements an interface to CHILDES, an open repository for transcripts of parent-child interaction. There is a vignette.
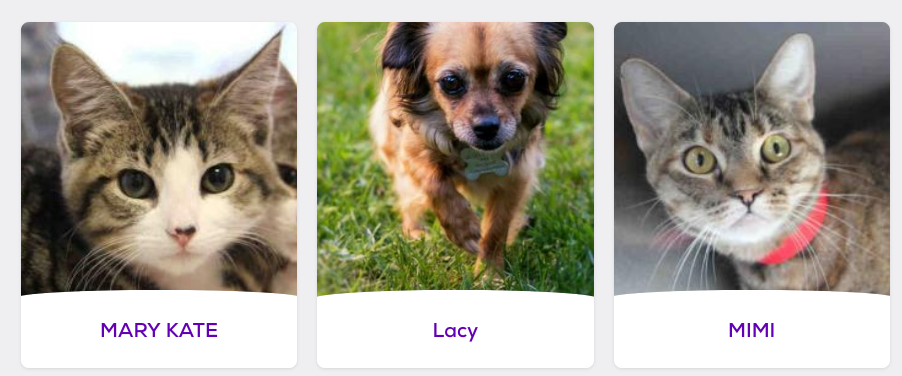
PetfindeR v1.1.3: Is a wrapper of the Petfinder API that implements methods for interacting with and extracting data from the Petfinder database, one of the largest online, searchable databases of adoptable animals and animal welfare organizations across North America. See the Getting Started Guide: part1 and part2.
Data Science
catch v1.0: Provides functions to perform classification and variable selection on high-dimensional tensors (multi-dimensional arrays) after adjusting for additional covariates (scalar or vectors) as CATCH model in Pan, Mai and Zhang (2018).
SemiSupervised v1.0: Implements several safe graph-based semi-supervised learning algorithms. For technical details, refer to Culp and Ryan (2013), Ryan and Culp (2015) and the package vignette.
spFSR v1.0.0: Offers functions to perform feature selection and ranking via simultaneous perturbation stochastic approximation (SPSA-FSR) based on works by Aksakalli and Malekipirbazari (2015) and Yenice et al. (2018). See the Introduction.
Finance
PortfolioAnalytics v1.1.0: Provides functions for portfolio analysis, including numerical methods for portfolio optimization. There is an Introduction and vignettes on Optimization, Custom Moment and Objective Functions, and Portfolio Optimization with CVaR Budgets.
sparseIndexTracking v0.1.0: Provides functions to compute sparse portfolios for financial index tracking, i.e., joint selection of a subset of the assets that compose the index and computation of their relative weights (capital allocation) based on the paper Benidis et al. (2018). The vignette shows how to design a portfolio to track an index.
![]()
Mathematics
freegroup v1.0: Provides functions to elements of the free group, including inversion, multiplication by a scalar, group-theoretic power operation, and Tietze forms. See the vignette for details.
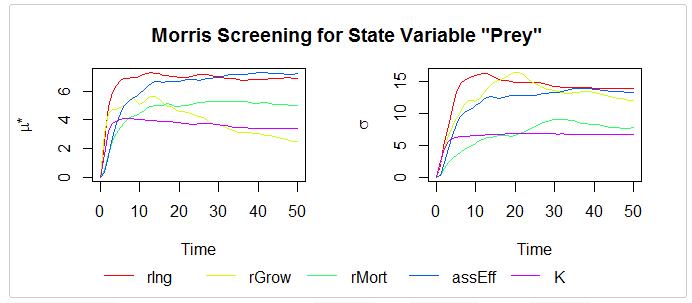
ODEsensitivity v1.1.1: Provides functions to perform sensitivity analysis for ordinary differential equation (ode) models using the ODEnetwork package, which simulates a network of second-order ODEs. See [Weber et al. (2018)(https://eldorado.tu-dortmund.de/handle/2003/36875)] for details, and the vignette to get started.
Music
stemmatoloty v0.3.1: Allows users to explore and analyze the genealogy of textual or musical traditions from their variants, with various stemmatological methods, mainly the disagreement-based algorithms suggested by Camps and Cafiero (2015). The vignette provides details.
Science
bioacoustics v0.1.2: Provides functions to analyze audio recordings and automatically extract animal vocalizations. Contains all the necessary tools to process audio recordings of various formats (e.g., WAV, WAC, MP3, ZC), filter noisy files, display audio signals, and detect and extract automatically acoustic features for further analysis such as classification. The vignette provides an example.
epiphy v0.3.4: Provides a toolbox for analyzing plant disease epidemics and a common framework for plant disease intensity data recorded over time and/or space. There is a vignette on Definitions and Relationships between Parameters and another with Examples.
treedater v0.2.0: Offers functions for estimating times of common ancestry and molecular clock rates of evolution using a variety of evolutionary models. See Volz and Frost (2017). The vignette provides an example using the Influenza H3N2 virus.
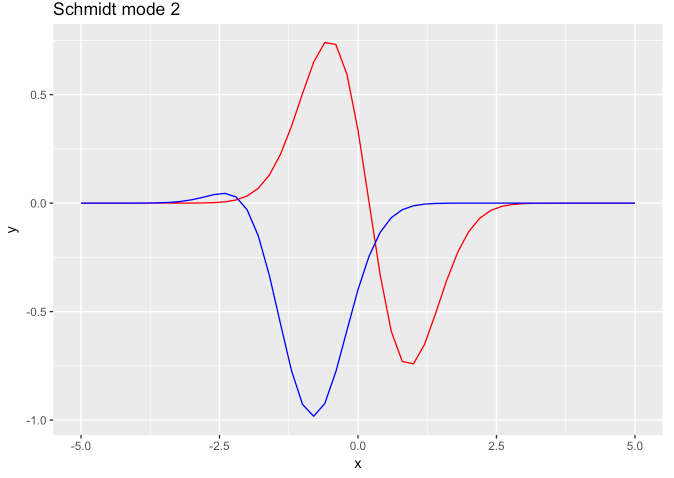
RQEntangle v0.1.0: Provides functions to compute the Schmidt decomposition of bipartite quantum systems, discrete or continuous, and their respective entanglement metrics. See Ekert and Knight (1995) and the vignettes Entanglement in Coupled Harmonics and Entanglement between Two Coupled Two-Level Systems for details.
Statistics
glmmboot v0.1.2: Provides two functions to perform bootstrap resampling for most models that update() works for. BootGlmm() performs block resampling if random effects are present, and case resampling if not; BootCI() converts output from bootstrap model runs into confidence intervals and p-values. See Humphrey and Swingley (2018) for the details and the vignette to get started.
glmmEP v1.0-1: Allows users to solve Generalized Linear Mixed Model Analysis via Expectation Propagation. In this version, the random effects can be any reasonable dimension. However, only probit mixed models with one level of nesting are supported. See the methodology in Hall et al. (2018), and the user manual in the vignette.
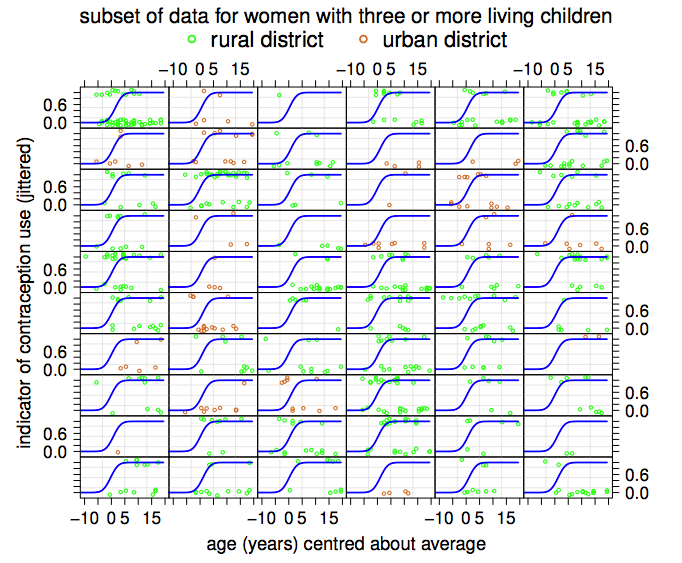
groupedSurv v1.0.1: Provides Rcpp-based functions to compute the efficient score statistics for grouped time-to-event data (Prentice and Gloeckler (1978)), with the optional inclusion of baseline covariates. The vignette gives an example.
modeldb v0.1.0: Provides functions to fit models inside databases with dplyr backends. There are vignettes showing how to implement linear regression and kmeans models.

MLZ v0.1.1: Provides estimation functions and diagnostic tools for mean length-based total mortality estimators based on Gedamke and Hoenig (2006). There is a vignette.
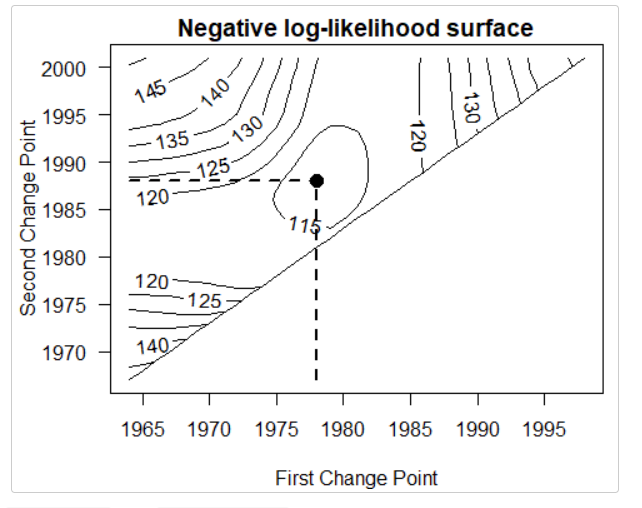
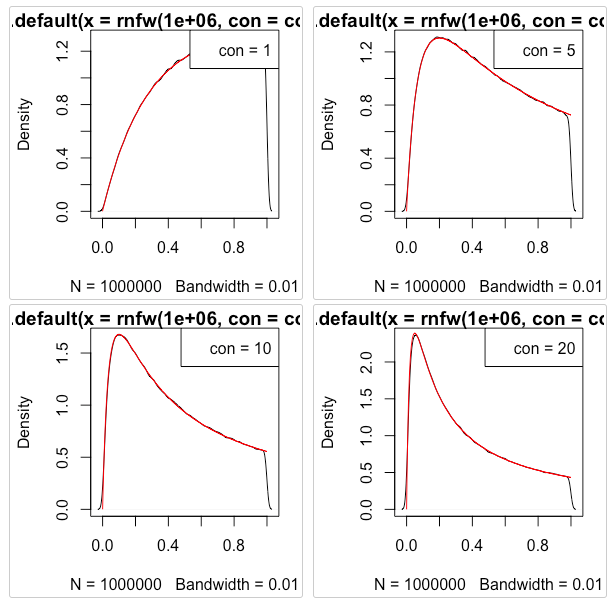
NFWdist v0.1.0: Provides density, distribution function, quantile function, and random generation for the 3D Navarro, Frenk & White (NFW) profile. For details see Robotham & Howlett (2018) and the vignette.
survBootOutliers v1.0: Offers three new concordance-based methods for outlier detection in a survival context. The methodology is described in two papers by Pinto J., Carvalho A. and Vinga S.: paper1 and paper2. The vignette provides an introduction.
vinereg v0.3.0: Implements D-vine quantile regression models with parametric or non-parametric pair-copulas. See Kraus and Czado (2017) and Schallhorn et al. (2017). There is a vignette showing how to use the package, and another covering an Analysis of bike rental data.
Time Series
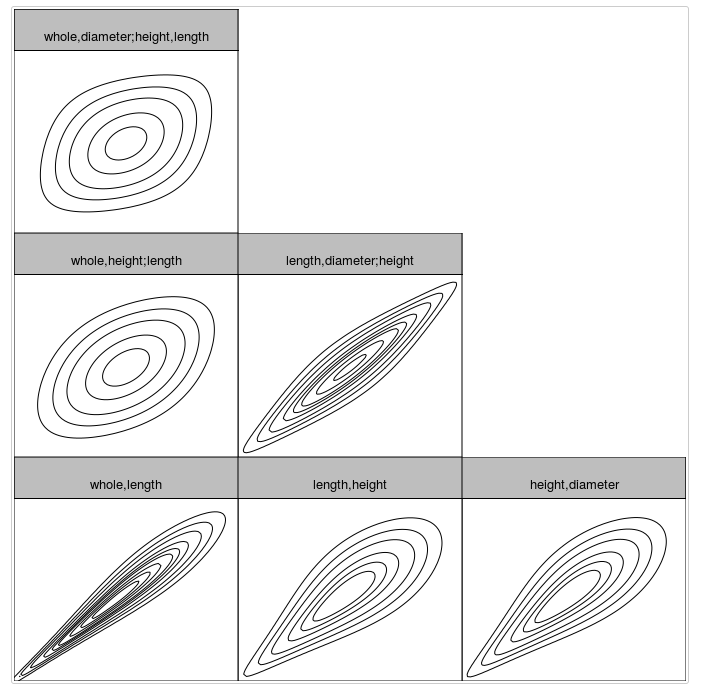
ASSA v1.0: Provides functions to model and decompose time series into principal components using singular spectrum analysis. See de Carvalho and Rua (2017) and de Carvalho et al (2012).
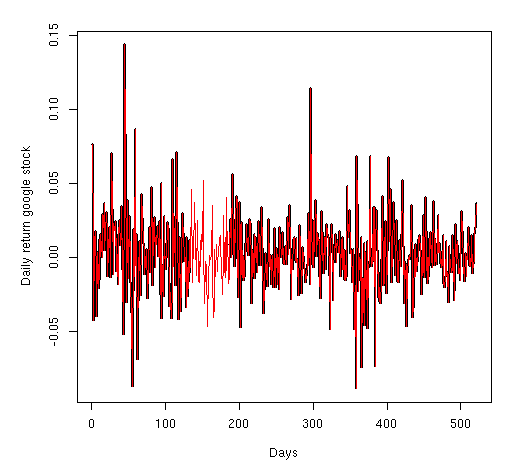
DTWBI v1.0: Provides functions to impute large gaps within time series based on Dynamic Time Warping methods. See Phan et al. (2017). The website has examples.
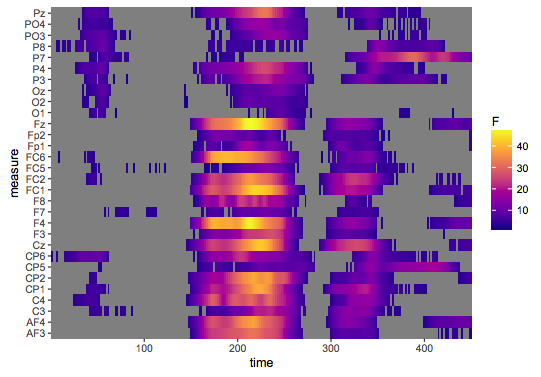
permutes v0.1: Uses permutation testing (Maris & Oostenveld (2007)) to help determine optimal windows for analyzing densely-sampled time series. The vignette provides details.
Utilities
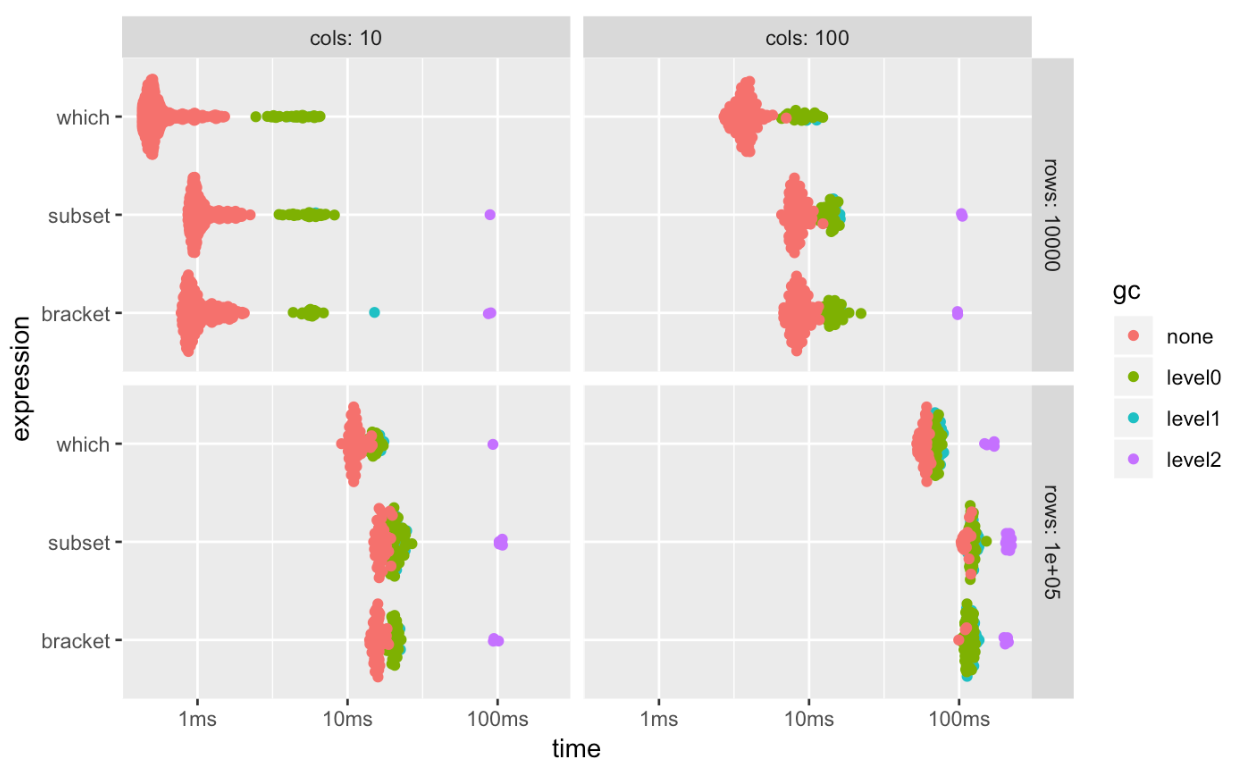
bench v1.0.1: Provides tools to benchmark and analyze execution times for R expressions.
conflicted v0.1.0: Provides an alternative to R’s default conflict-resolution strategy for R packages.
diffdf v1.0.0: Provides functions for comparing two data frames. The vignette describes how to use the package.
pkgdown v1.1.0: Provides functions to generate a website from a source package by converting your documentation, vignettes, README, and more to HTML. See the vignette.
rtika v0.1.8: Provides functions to extract text or metadata from over a thousand file types, using Apache Tika to produce either plain-text or structured XHTML content. See the vignette.
tabulizer v0.2.2: Provides bindings for the Tabula Java library, which can extract tables from PDF documents. The tabulizerjars packages provides versioned .jar files. There is an Introduction.
shinytest v1.3.0: Enables automated testing of Shiny applications, using a headless browser.
vcr v0.1.0: A port of the Ruby gem of the same name, vcr enables users to record test suite HTTP requests and replay them during future runs. There is an Introduction and vignettes on Configuration and Request Matching
Visualization
c3 v0.2.0: Implements a wrapper (htmlwidget) for the C3.js charting library that includes all types of C3.js plots, enabling interactive web-based charts to be embedded in R Markdown documents and Shiny applications. The vignette shows basic usage.

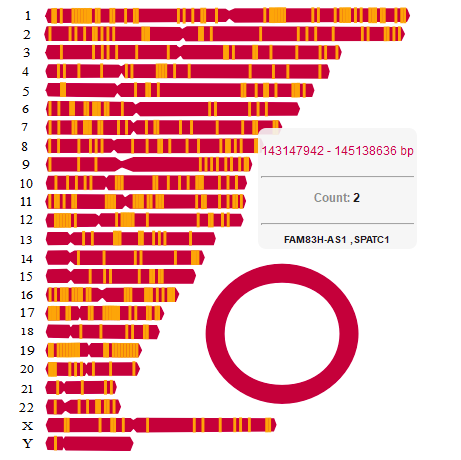
chromoMap v0.1: Provides interactive, configurable graphics visualizations of human chromosomes, allowing users to map chromosome elements (like genes, SNPs, etc.) on the chromosome plot, and introduces a special plot, the “chromosome heatmap”, which enables visualizing data associated with chromosome elements. See the vignette.
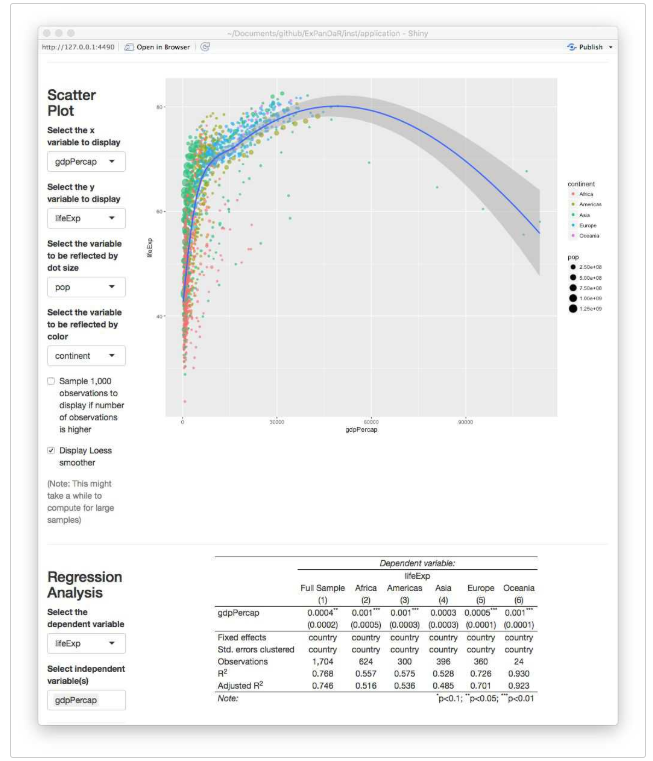
ExPanDaR v0.2.0: Provides a shiny-based front end and a set of functions for exploratory panel data analysis. Run as a web-based app, it enables users to assess the robustness of empirical evidence without providing them access to the underlying data. There is a vignette on using the package and another on panel data exploration.
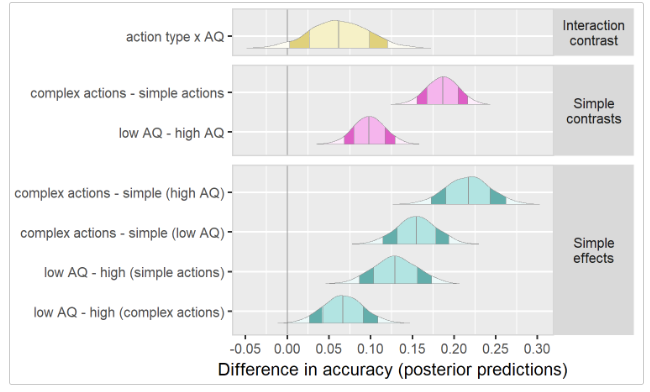
ggdistribute v1.0.1: Extends ggplot2 for plotting posterior or other types of unimodal distributions that require overlaying information about a distribution’s intervals. The vignette provides examples.
r2d3 v0.2.2: Provides a suite of tools for using the D3 library to produce dynamic, interactive data visualizations. There are vignettes on Advanced Rendering with Callbacks, R to D3 Data Conversion, CSS & JavaScript Dependencies, Learning D3, Package Development, and D3 Visualization Options.

You may leave a comment below or discuss the post in the forum community.rstudio.com.