September was another relatively slow month for new package activity on CRAN: “only” 126 new packages by my count. My Top 40 list is heavy on what I characterize as “utilities”: packages that either extend R in some fashion or make it easier to do things in R. This month, the packages I selected fall into eight categories: Data, Finance, Machine Learning, Science, Statistics, Time Series, Utilities and Visualization.
Data
trigpoints v1.0.0: Contains a complete data set of historic GB trig points (fixed survey points that help mapmakers and hikers) in British National Grid (OSGB36) coordinate reference system.
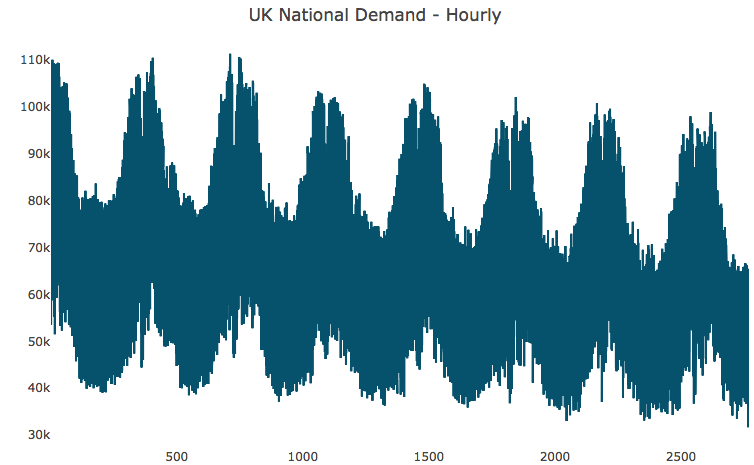
UKgrid v0.1.0: Provides a time series of the national grid demand (high-voltage electric power transmission network) in the UK since 2011. The vignette shows how to use the package.
Finance
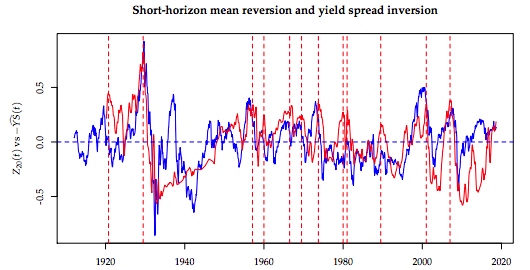
jubilee v0.2-5: Implements a long-term forecast model called Jubilee-Tectonic model to forecast future returns of the U.S. stock market, Treasury yield, and gold price. The vignette shows the math.
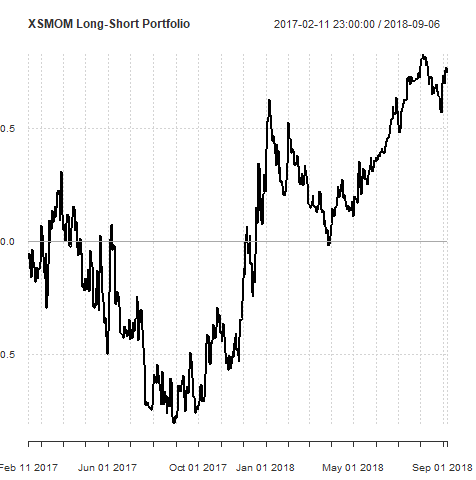
portsort v0.1.0: Provides functions to sort assets into portfolios for up to three factors via a conditional or unconditional sorting procedure. There is an Introduction.
Machine Learning
crfsuite v0.1.1: Wraps the CRFsuite library allowing users to fit a conditional random field model. The focus is Natural Language Processing, and there are models for named entity recognition, text chunking, part of speech tagging, intent recognition, and classification. The vignette shows how to use the package.
ELMSO v1.0.0: Implements the algorithm described in Paulson, Luo, and James (2018); see here for a full-text version of the paper. The algorithm allocates budget across a set of online advertising opportunities.
embed v0.0.1: Provides functions to convert factor predictors to one or more numeric representations using simple generalized linear models or nonlinear models.
newsmap v0.6: Implements a semi-supervised model for geographical document classification ([Watanabe (2018)])(doi:10.1080⁄21670811.2017.1293487) with seed dictionaries in English, German, Spanish, Japanese, and Russian. See the README for an example.
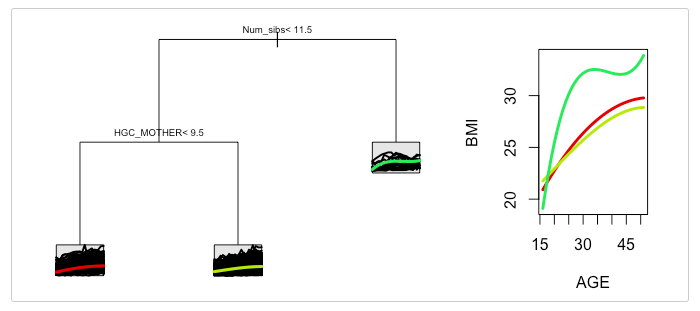
splinetree v0.1.0: Provides functions to build regression trees and random forests for longitudinal or functional data using a spline projection method. Implements and extends the work of Yu and Lambert (1999). There is an Introduction and vignettes on trees and forests.
stylest v0.1.0: Provides functions to estimate the distinctiveness in speakers’ (authors’) style. Fits models that can be used for predicting speakers of new texts. See Spirling et al (2018) for the details and the vignette for an example on how to use the package.
Science
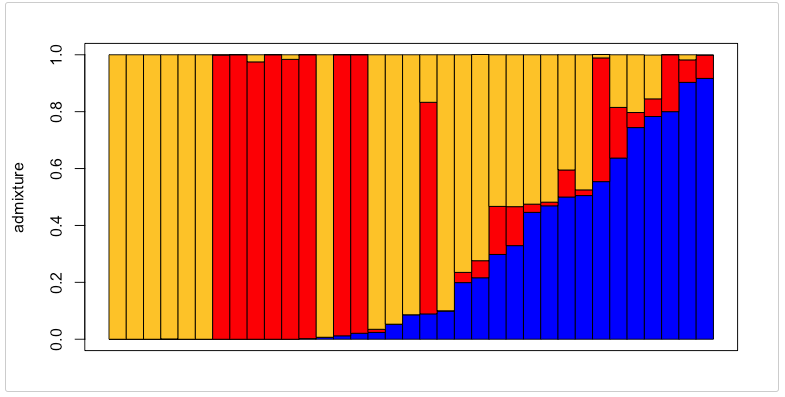
conStruct v1.0.0: Provides a method for modeling genetic data as a combination of discrete layers, within each of which relatedness may decay continuously with geographic distance. There are vignettes for formatting data, model construction, and on running and visualizing consStruct analyses.
episcan v0.0.1: Provides some efficient mechanisms to scan epistasis in genome-wide interaction studies (GWIS), and supports both case-control status (binary outcome) and quantitative phenotype (continuous outcome) studies. See Kam-Thong and Cxamara et al. (2011), Kam-Thong and Pütz et al. (2011), and the vignette.
Statistics
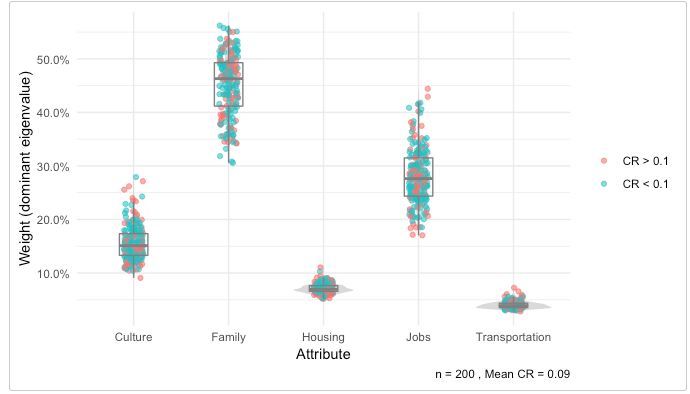
ahpsurvey v0.2.2: Implements the Analytic Hierarchy Process, a versatile multi-criteria decision-making tool introduced by Saaty (1987) that allows decision-makers to weigh attributes and evaluate alternatives presented to them. The vignette provides examples.
empirical v0.1.0: Implements empirical univariate probability density functions (continuous functions) and empirical cumulative distribution functions (step functions or continuous). The vignette provides examples.
basisMCMCplots v0.1.0: Provides functions for examining posterior MCMC samples from a single and multiple chains that interface with the NIMBLE software package. See de Valpine et al. (2017).
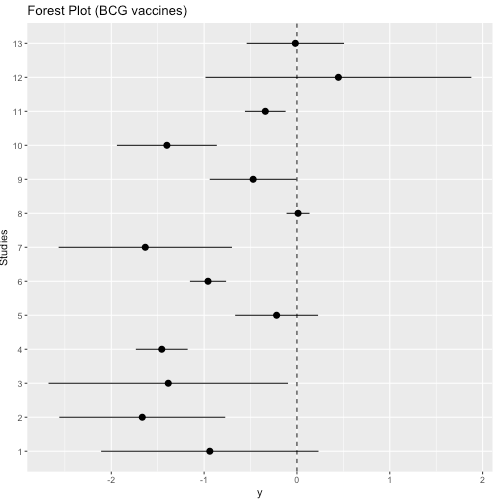
MetaStan v0.0.1: Provides functions to perform Bayesian meta-analysis using Stan. Includes binomial-normal hierarchical models and option to use weakly informative priors for the heterogeneity parameter and the treatment effect parameter, which are described in Guenhan, Roever, and Friede (2018). The vignette contains an example.
Opt4PL v0.1.1: Provides functions to obtain and evaluate various optimal designs for the 3-, 4-, and 5-parameter logistic models. The optimal designs are obtained based on the numerical algorithm in Hyun, Wong, Yang (2018).
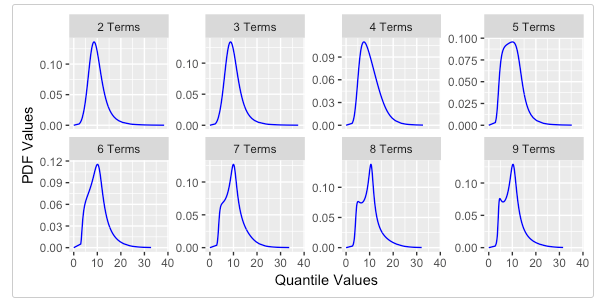
rmatalog v1.0.0: Implements the metalog distribution, a modern, highly flexible, data-driven distribution. See Keelin (2016). The vignette provides an example.
rwavelet v0.1.0: Provides functions to perform wavelet analysis (orthogonal and translation invariant transforms) with applications to data compression or denoising. Most of the code is a port of the MATLAB Wavelab toolbox written by Donoho, Maleki and Shahram. The vignette provides examples.

samplingBigData v1.0.0: Provides methods for sampling large data sets, including spatially balanced sampling in multi-dimensional spaces with any prescribed inclusion probabilities. Written in C, it uses efficient data structures such as k-d trees that scale to several million rows on a modern desktop computer.
survivalAnalysis v0.1.0: Implements a high-level interface to perform survival analysis, including Kaplan-Meier analysis and log-rank tests and Cox regression. There are vignettes for univariate and multivariate survival analyses.

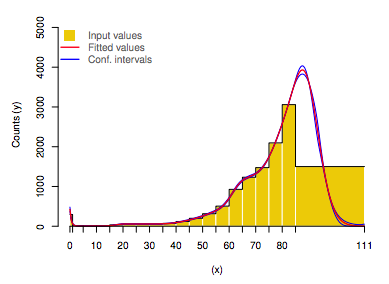
ungroup v1.1.0: Provides functions to implement a penalized composite link model for efficient estimation of smooth distributions from coarsely binned data. For a detailed description of the method and applications, see Rizzi et al. (2015). The vignette provides examples.
Time Series
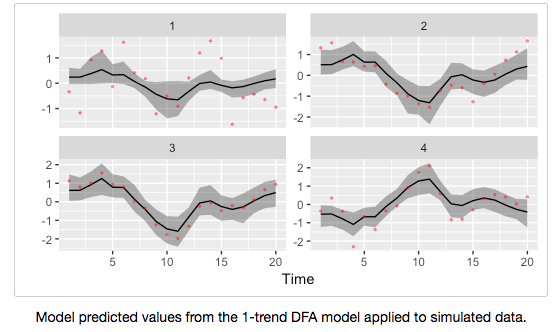
bayesdfa v0.1.0: Implements Bayesian dynamic factor analysis, a dimension-reduction tool for multivariate time series, with Stan. The vignette shows how to identify extremes and latent regimes with glmmfields.
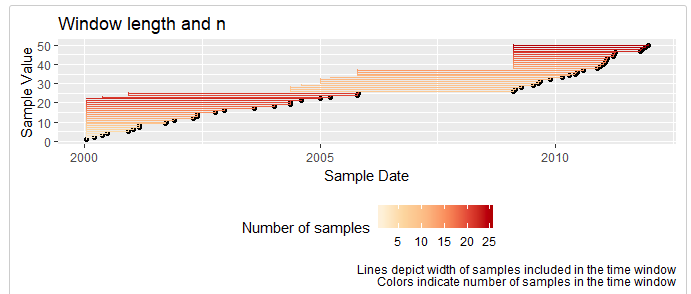
tbrf v0.1.0: Provides rolling statistical functions based on date and time windows instead of n-lagged observations. The vignette offers examples.
Utilities
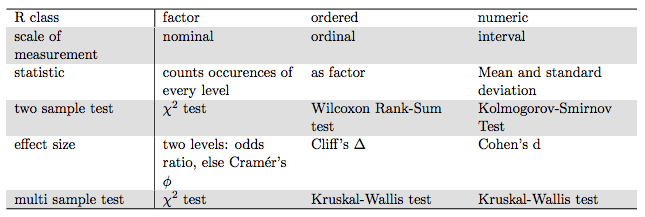
atable v0.1.0: Provides functions to create tables for reporting clinical trials, calculate descriptive statistics and hypotheses tests, and arrange the results in a table with LaTeX or Word. The vignette provides examples.
av v0.2: Implements bindings to the FFmpeg AV library for working with audio and video in R.
binb v0.0.2: Provides a collection of LaTeX styles using Beamer customization for PDF-based presentation slides in RMarkdown. The vignette provides an example.
broom.mixed v0.2.2: Converts fitted objects from various R mixed-model packages into tidy data frames along the lines of the broom package.
codified v0.2.0: Allows authors to augment clinical data with metadata to create output used in conventional publications and reports. See the vignette for examples.
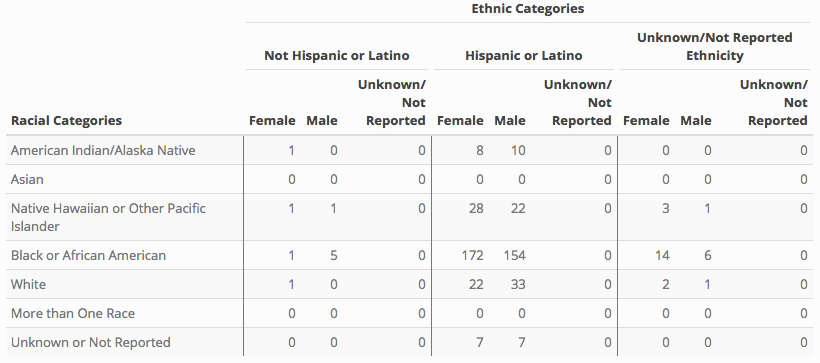
duawrangler v0.6.3: Allows users to create shareable data sets from raw data files that contain protected elements. There are vignettes on the motivation for the package and on securing data.
ipc v0.1.0: Provides tools for passing messages between R processes with Shiny Examples showing how to perform useful tasks. The vignette shows how to use the package.
piggyback v0.0.8: Works around git’s 50MB commit limit to allow larger (up to 2 GB) data files to piggyback on a repository as assets attached to individual GitHub releases. There is a package overview and a vignette on alternatives.
pysd2r v0.1.0: Uses reticulate to implement an interface to the pysd toolset, provides a number of pysd functions, and can read files in Vensim, mdl, and xmile formats. The vignette provides an overview.
radix v0.5: Provides functions to format scientific and technical articles for the web with Radix reader-friendly typography, flexible layout options for visualizations, and full support for footnotes and citations.
rbtc v0.1-5: Implements the RPC-JSON API for Bitcoin and provides utility functions for address creation and content analysis of the blockchain.
salty v0.1.0: Lets users take real or simulated data and salt it with errors commonly found in the wild, such as pseudo-OCR errors, Unicode problems, numeric fields with nonsensical punctuation, bad dates, etc. See README for examples.
Visualization
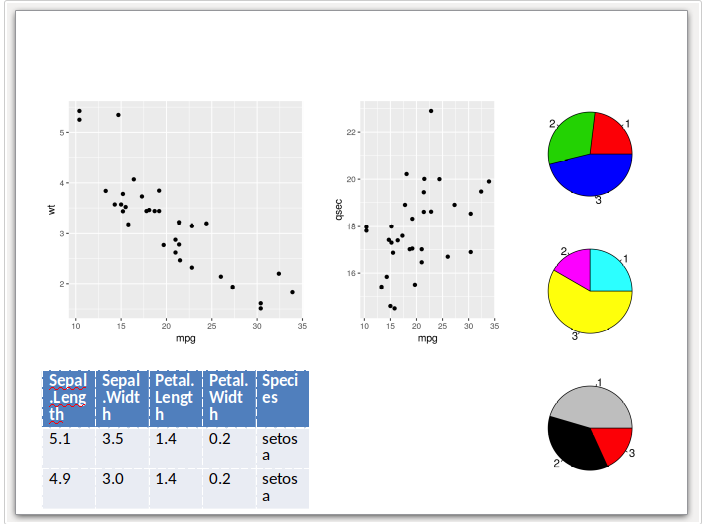
customLayout v0.2.0: Offers an extended version of the graphics::layout() function that also supports grid graphics, allowing users to create complicated drawing areas for multiple elements by combining much simpler layouts. The vignette for PowerPoint.
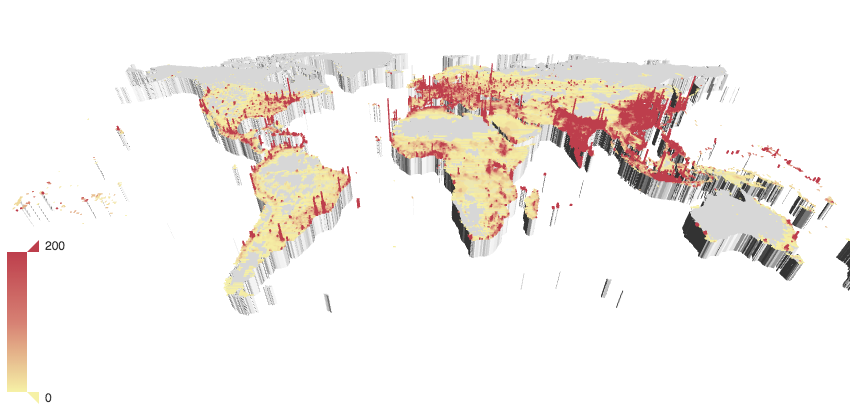
echarts4r v0.1.1: Allows users to create interactive charts by leveraging the Echarts JavaScript library. It includes 33 chart types, themes, Shiny proxies, and animations. Look here for an example.
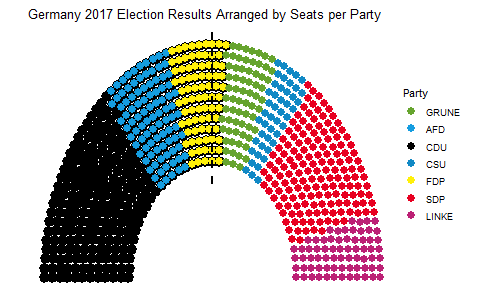
ggparliament v2.0.0: Provides parliament plots to visualize election results as points in the architectural layout of the legislative chamber. There are vignettes for arranging parliament, basic plots, drawing majorities, emphasizing parliamentarians, faceting, hanging seats, highlighingt government, and labeling parties.
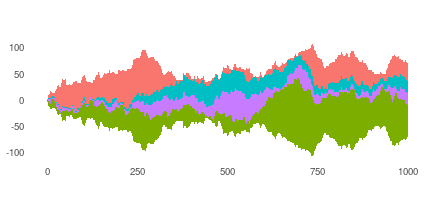
ggTimeSeries v1.0.1: Provides additional time series visualizations, such as calendar heat map, steamgraph, and marimekko. There is a vignette.
You may leave a comment below or discuss the post in the forum community.rstudio.com.