Having absorbed an average of 181 new packages each month over the last 28 months, CRAN is still growing at a pretty amazing rate. The following plot shows the number of new packages since I started keeping track in August 2016.
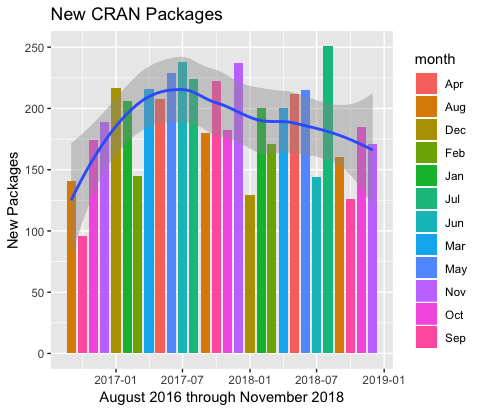
This November, 171 new packages stuck to CRAN. Here is my selection for the “Top 40” organized into the categories: Computational Methods, Data, Finance, Machine Learning, Marketing Analytics, Science, Statistics, Utilities and Visualization.
Computational Methods
mixsqp v0.1-79: Provides optimization algorithms (Kim et al. (2012) based on sequential quadratic programming (SQP) for maximum likelihood estimation of the mixture proportions in a finite mixture model where the component densities are known. The vignette shows how to use the package.
polylabelr v0.1.0: Implements a wrapper around the C++ library polylabel from Mapbox, providing an efficient routine for finding the approximate pole of inaccessibility of a polygon. See README.

Riembase v0.2.1: Implements a number of algorithms to estimate fundamental statistics including Fréchet mean and geometric median for manifold-valued data. See Bhattacharya and Bhattacharya (2012) if you are interested in statistics on manifolds, and Absil et al (2007) for information on the computational aspects of optimization on matrix manifolds.
SolveRationalMatrixEquation v0.1.0: Provides functions to find the symmetric positive definite solution X such that X = Q + L (X inv) L^T given a symmetric positive definite matrix Q and a non-singular matrix L. See Benner et al. (2007) for the details and the vignette for an example.
Data
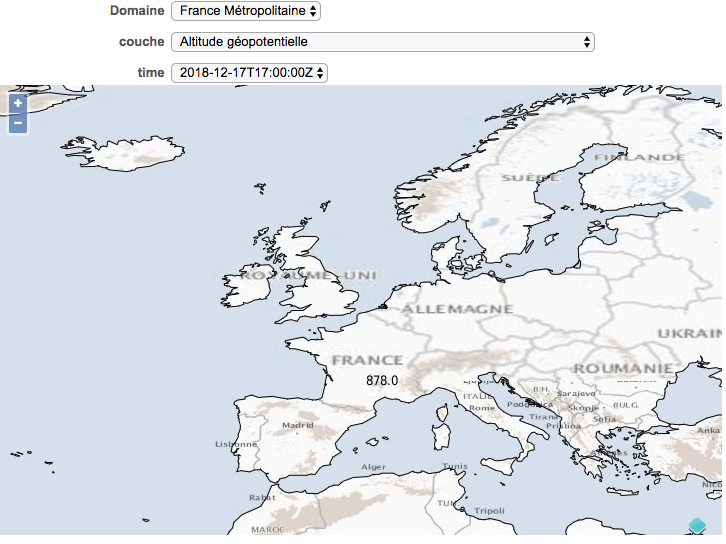
metsyn v0.1.2: Provides an interface to the Meteo France Synop data API. This is meteorological data recorded every 3 on 62 French meteorological stations.
neonUtilities v1.0.1: Provides an interface to the National Ecological Observatory NEON API. For more information, see the README file.
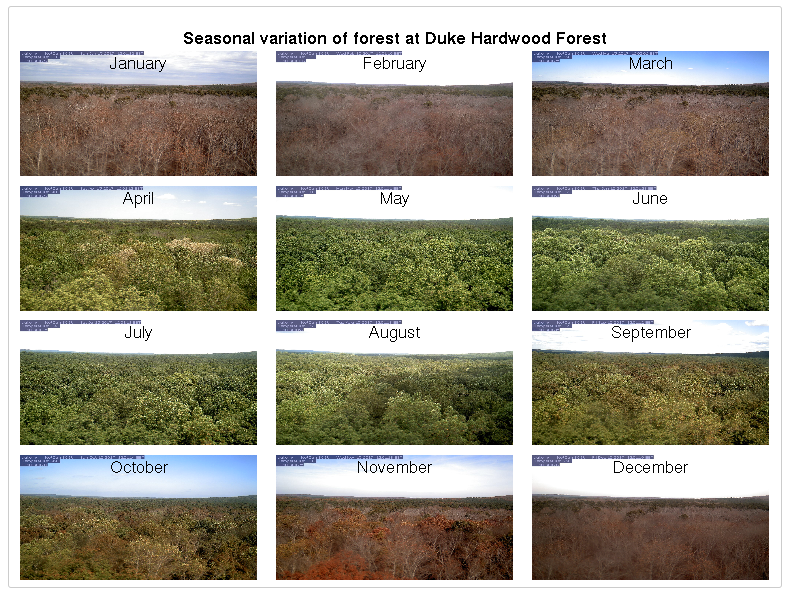
phenocamapi v0.1.2: Allows users to obtain phenological time-series and site metadata from the PhenoCam network. There is a Getting Started Guide and a vignette with examples.
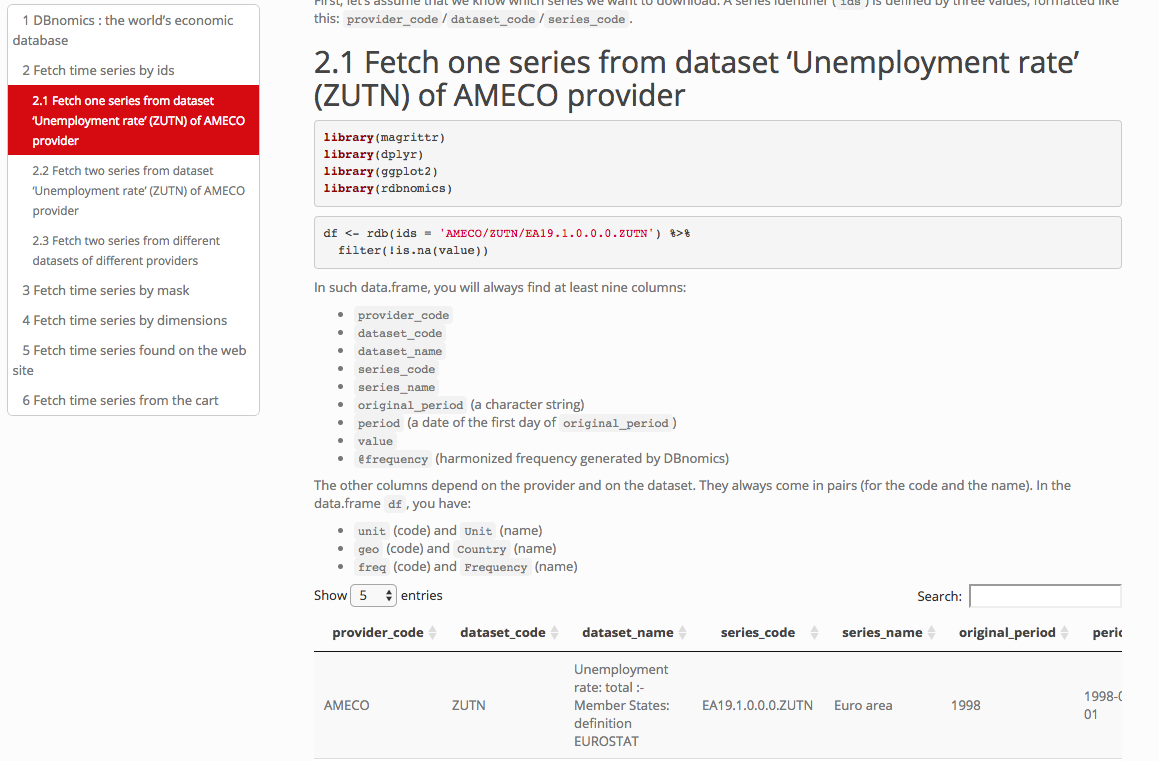
rdbnomics v0.4.3: Provides access to hundreds of millions data series from DBnomics API. See the vignette for examples.
restez v1.0.0: Allows users to download large sections of GenBank and generate a local SQL-based database. A user can then query this database using restez functions.
Finance
crseEventStudy v1.0: Implements the Dutta et al. (2018) standardized test for abnormal returns in long-horizon event studies to improve the power and robustness of the tests described in Kothari/Warner (2007).
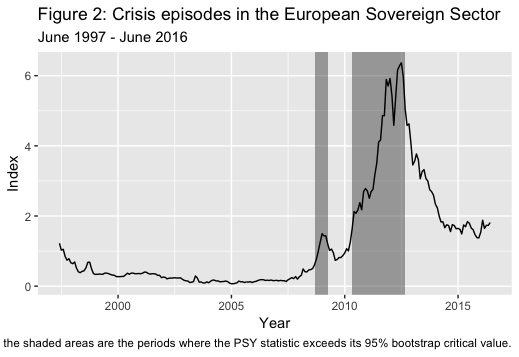
psymonitor v0.0.1: Provides functions to apply the real-time monitoring strategy proposed by Phillips, Shi and Yu (2015) (and here) to test for “bubbles”. There is a vignette on detecting crises and another on monitoring bubbles.
Machine Learning
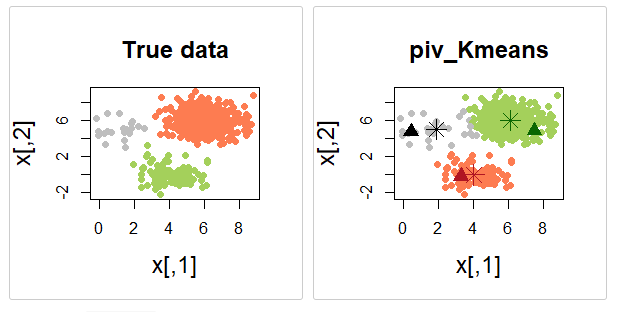
pivmet v0.1.0: Provides a collection of pivotal algorithms for relabeling the MCMC chains in order to cope with the label switching problem in Bayesian mixture models. Functions also initialize the centers of the classical k-means algorithm in order to obtain a better clustering solution. There is a vignette on K-means clustering and another on Label Swithching.
RDFTensor v1.0: Implements tensor factorization techniques suitable for sparse, binary and three-mode RDF tensors. See Nickel et al. (2012), Lee and Seung, Papalexakis et al. and Chi and T. G. Kolda (2012) for details.
rfviz v1.0.0: Provides an interactive data visualization and exploration toolkit that implements Breiman and Cutler’s original Java based, random forest visualization tools. It includes both supervised and unsupervised classification and regression algorithms. The Berkekey website describes the original implementation.
rJST v1.0: Provides functions to stimulate the Joint Sentiment Topic model as described by Lin and He (2009) and Lin et al. (2012). See the Introduction for details.
Marketing Analytics
Marketmatching v1.1.1: Enables users to find the best control markets using time series matching and analyze the impact of an intervention. Uses the dtw package to do the matching and the CausalImpact package to analyze the causal impact. See the vignette for an example.
Science
EpiSignalDetection v0.1.1: Provides functions to detect possible outbreaks using infectious disease surveillance data at the European Union / European Economic Area or country level. See Salmon et al. (2016) for a description of the automatic detection tools and the vignette for an overview of the package.
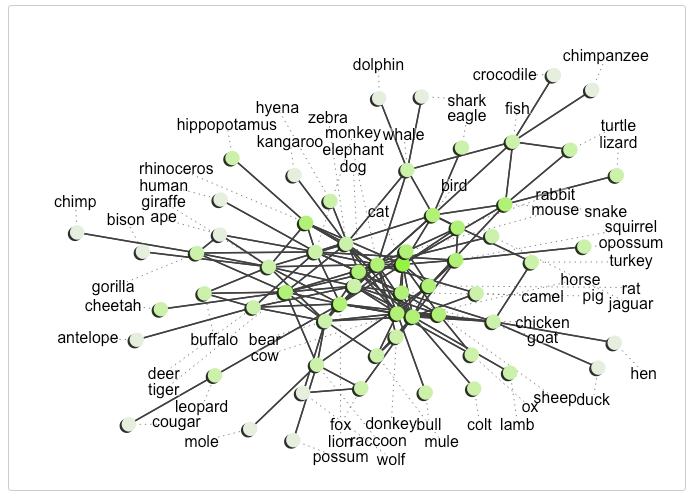
memnet v0.1.0: Implements network science tools to facilitate research into human (semantic) memory including several methods to infer networks from verbal fluency data, various network growth models, diverse random walk processes, and tools to analyze and visualize networks. See Wulff et al. (2018) and the vignette for an introduction.
phylocomr v0.1.2: Implements an interface to Phylocom, a library for analysis of phylogenetic community structure and character evolution. See the vignette for and introduction to the package.
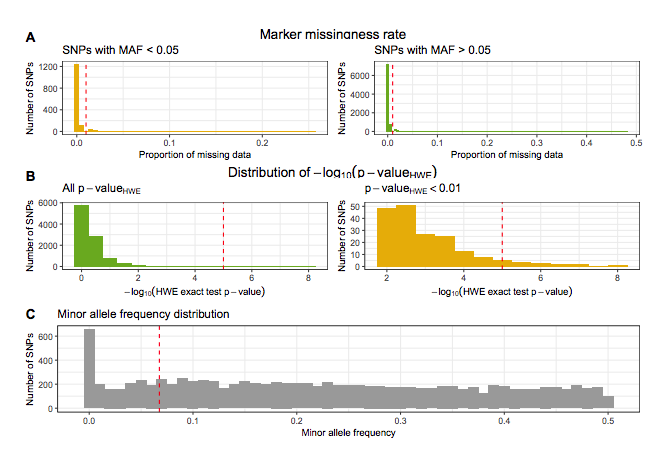
plinkQC v0.2.0: Facilitates genotype quality control for genetic association studies as described by Anderson et al. (2010). There are vignettes on Ancestry Estimation, Processing 1000 Genomes, HapMap III Data and Genotype Quality Control.
Statistics
BivRec v1.0.0: Implements a collection of non-parametric and semiparametric methods to analyze alternating recurrent event data. See README for examples.
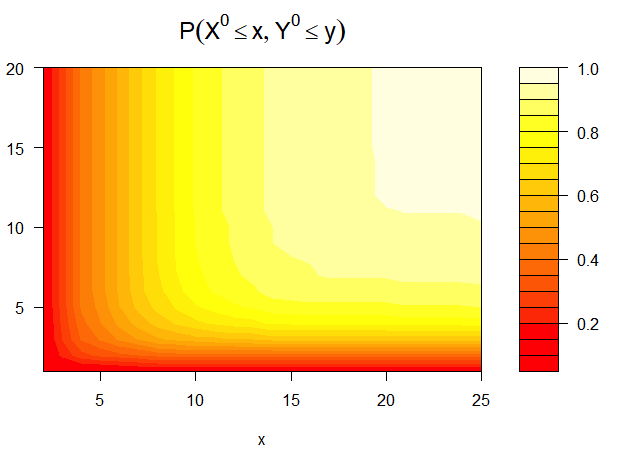
cusum v0.1.0: Provides functions for constructing and evaluating CUSUM charts and RA-CUSUM charts with focus on false signal probability. The vignette offers an example.
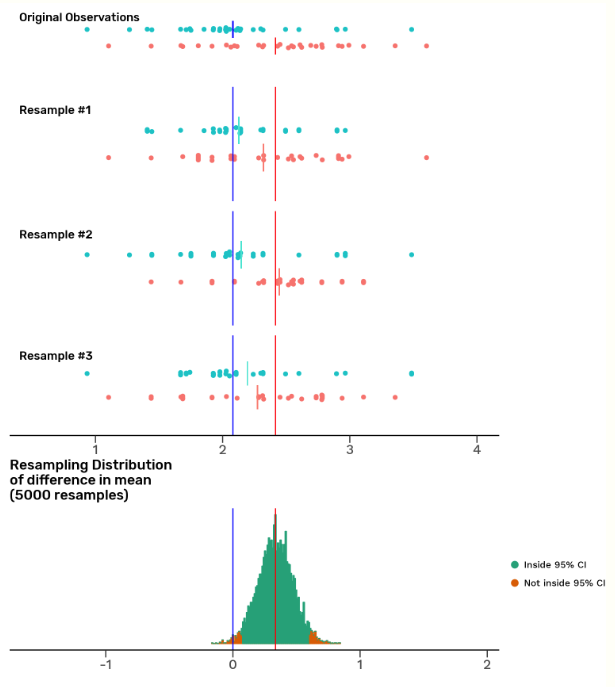
dabestr v0.1.0: Offers an alternative to significance testing using bootstrap methods and estimation plots. See Ho et al (2018). There is a vignette on Bootstrap Confidence Intervals, another on Statistical Visualizations, and a third on creating Estimation Plots.
deckgl v0.1.8: Implements an interface to deck.gl, a WebGL-powered open-source JavaScript framework for visual exploratory data analysis of large data sets and supports basemaps from mapbox. There are fourteen brief vignettes, each devoted to a different plot layer, but look here for a brief overview.

LindleyPowerSeries v0.1.0: Provides functions to compute the probability density function, the cumulative distribution function, the hazard rate function, the quantile function and random generation for Lindley Power Series distributions. See Nadarajah and Si (2018) for details.
modi v0.1.0: Implements algorithms that take sample designs into account to detect multivariate outliers. See Bill and Hulliger (2016) for details and the vignette for an introduction.
MPTmultiverse v0.1: Provides a function to examine the multiverse of possible modeling choices. See the paper by Steegen et al. (2016) and the vignette for an overview of the package.
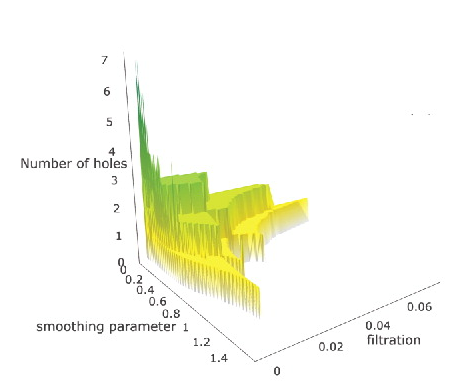
pterrace v1.0: Provides functions to plot the persistence terrace, a summary graphic for topological data analysis that helps to determine the number of significant topological features. See Moon et al. (2018).
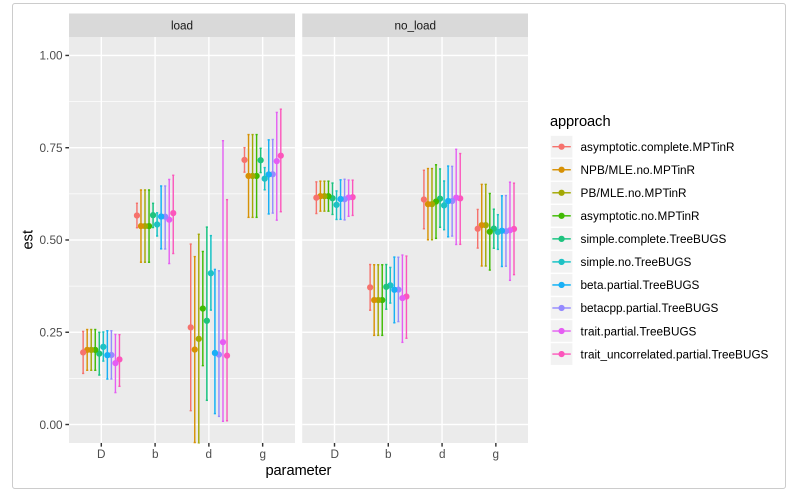
randcorr v1.0: Implements the algorithm by Pourahmadi and Wang (2015) for generating a random p x p correlation matrix by representing the correlation matrix using Cholesky factorization and hyperspherical coordinates. See Makalic and Schmidt (2018) for the sampling process used.
SMFilter v1.0.3: Provides filtering algorithms for the state space models on the Stiefel manifold as well as the corresponding sampling algorithms for uniform, vector Langevin-Bingham and matrix Langevin-Bingham distributions on the Stiefel manifold. See the vignette.
Utilities
IRkernel v0.8.14: Implements a native R kernel for Jupyter Notebook. See README for information on how to use the package.
lobstr v1.0.0: Provides set of tools for inspecting and understanding R data structures inspired by str(). See README for information on the included functions.
parsnip v0.0.1: Implements a common interface allowing users to specify a model without having to remember the different argument names across different functions or computational engines. The vignette goes over the basics.
pkgsearch v2.0.1: Allows users to search CRAN R packages using the METACRAN search server.
stevedore v0.9.0: Implements an interface to the Docker API. There is an Introduction and a vignette with Examples.
vctrs v0.1.0: Defines new notions of prototype and size that are used to provide tools for consistent and well-founded type-coercion and size-recycling. There are vignettes on S3 vectors, Type and Size Stability and Prototypes.
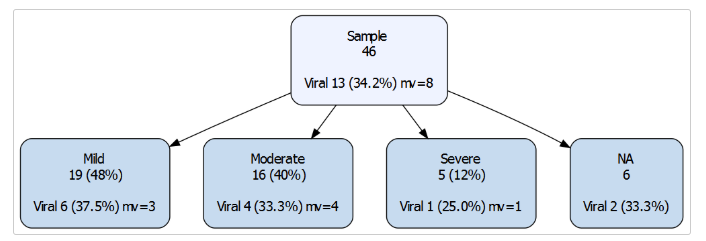
vtree v0.1.4: Provides a function for drawing drawing variable trees plots that display information about hierarchical subsets of a data frame defined by values of categorical variables. The vignette offers an introduction.
zipR v0.1.0: Implements the Python zip() function in R. See the vignette.
Visualization
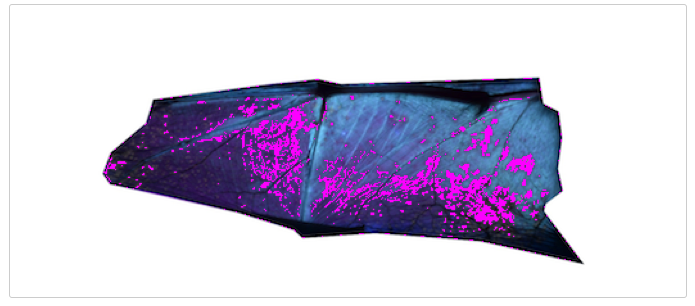
countcolors v0.9.0: Contains functions to count colors within color range(s) in images, and provides a masked version of the image with targeted pixels changed to a different color. Output includes the locations of the pixels in the images, and the proportion of the image within the target color range with optional background masking. There is an Introduction and an Example.
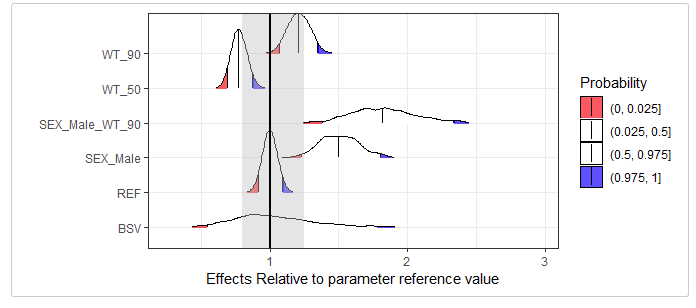
coveffectsplot v0.0.1: Provides forest plots to visualize covariate effects from either the command line or an interactive Shiny application. There is an Introduction.
You may leave a comment below or discuss the post in the forum community.rstudio.com.