Approximately 136 new packages stuck to CRAN in June. (This number is difficult to nail down with certainty because packages may be removed from CRAN after sitting there for a few days.) Here are my picks for the June “Top 40” in ten categories: Computational Methods, Data, Finance, Genomics, Machine Learning, Science and Medicine, Statistics, Time Series, Utilities, and Visualization.
Computational Methods
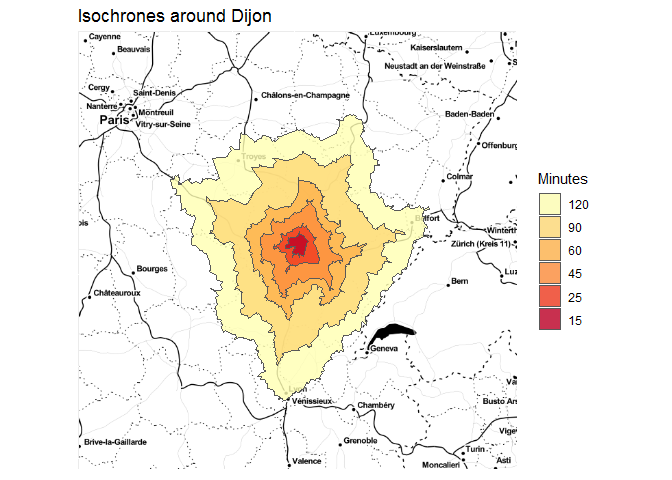
cppRouting v1.1: Provides functions to calculate distances, shortest paths and isochrones on weighted graphs using several variants of Dijkstra algorithm. Algorithms include unidirectional Dijkstra Dijkstra (1959), bidirectional Dijkstra Goldberg et al. (2005), A* search Hart et al. (1968), and new bidirectional A* Pijls & Post (2009). See the vignette and website for how to use the package.
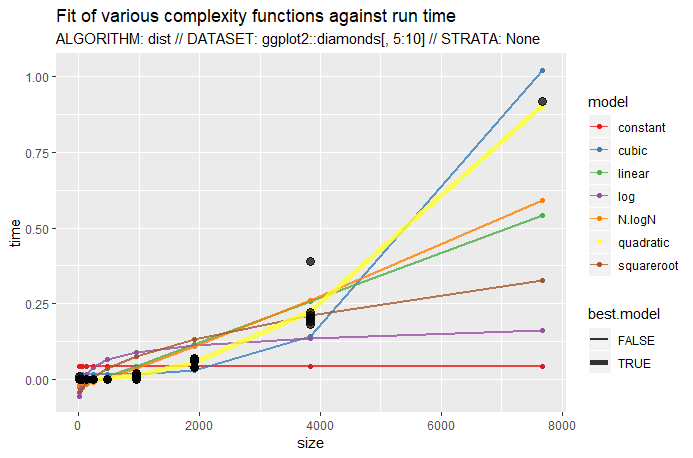
GuessCompx v1.0.3: Provides functions to test multiple increasing random samples of a data set, and tries to fit various complexity functions o(n), o(n2), o(log(n)), etc. to make an empirical guess about the time and memory complexities of an algorithm or a function. See the vignette for details.
SimJoint v0.2.1: Provides functions to simulate multivariate correlated data given non-parametric marginal distributions and their covariance structure, characterized by a correlation matrix from a purely computational perspective. See Iman and Conover (1982), Ruscio- and Kaczetow (2008), and the vignette for details.
Data
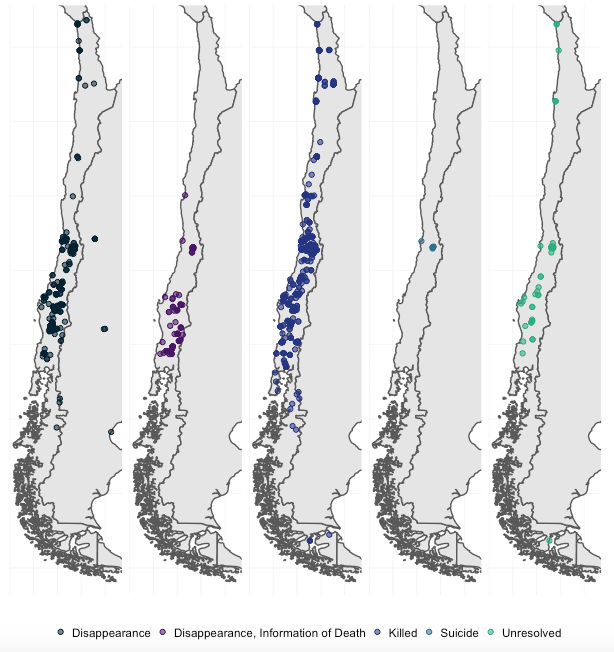
pinochet v0.1.0: Contains data about the victims of the Pinochet regime as compiled by the Chilean National Commission for Truth and Reconciliation Report (1991, ISBN:9780268016463). See the vignette.
usdarnass v:0.1.0: Offers an alternative for downloading various United States Department of Agriculture (USDA) data through R. There is a Getting Started Guide and a vignette on usdarnass output.
Finance
ceRtainty v1.0.0: Provides functions to compute the certainty equivalents and premium risks as tools for risk-efficiency analysis. For more technical information, see Hardaker et al. (2004), and Richardson and Outlaw (2008). The vignette contains examples.
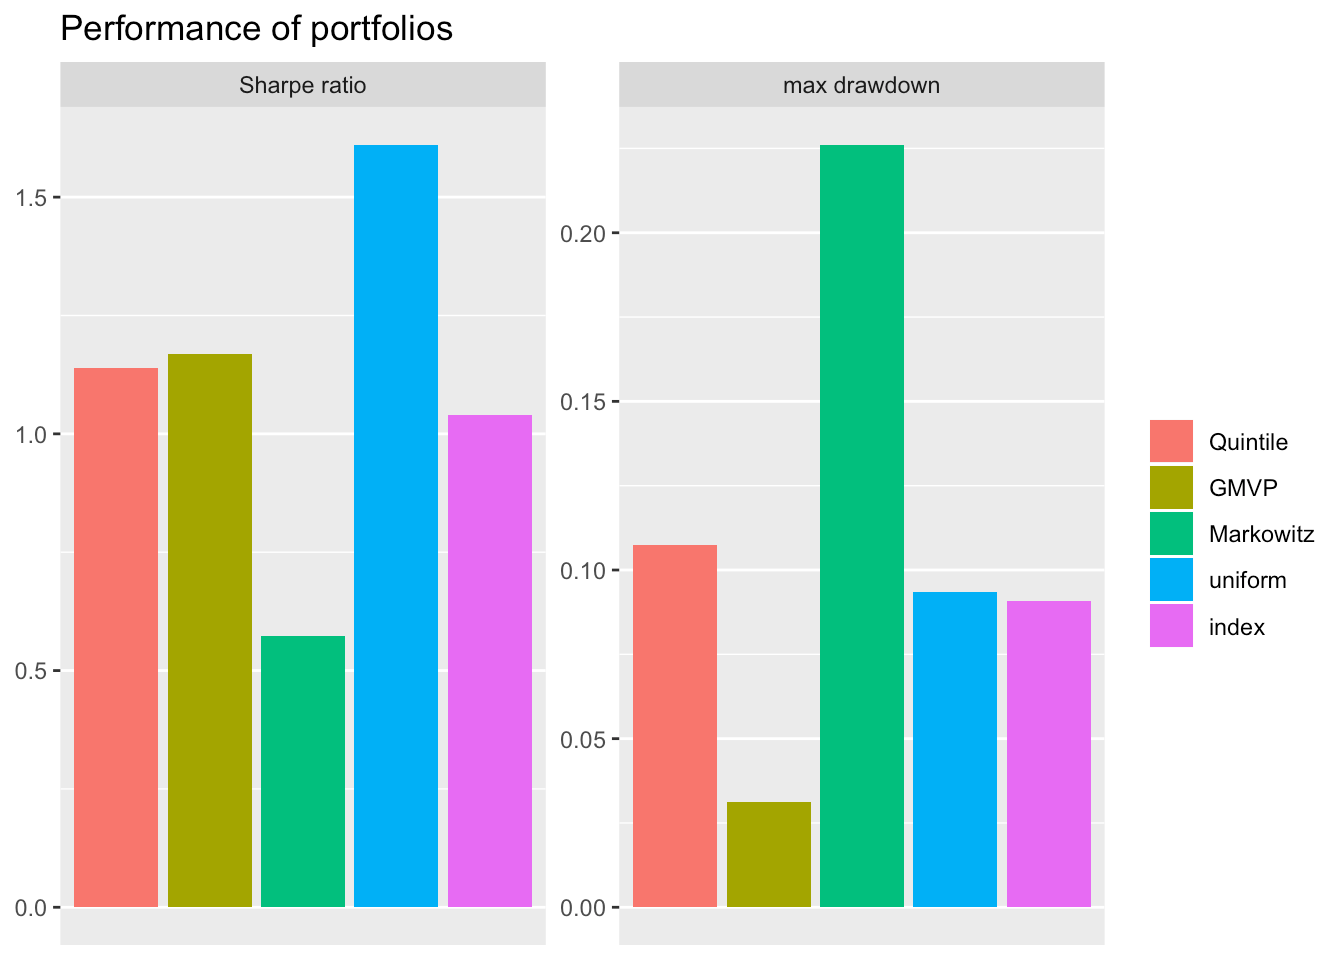
portfolioBacktest v0.1.1: Implements automated backtesting of multiple portfolios over multiple data sets of stock prices in a rolling-window fashion. Intended for researchers, practitioners, and Finance instructors. See the vignette to get started.
Genomics
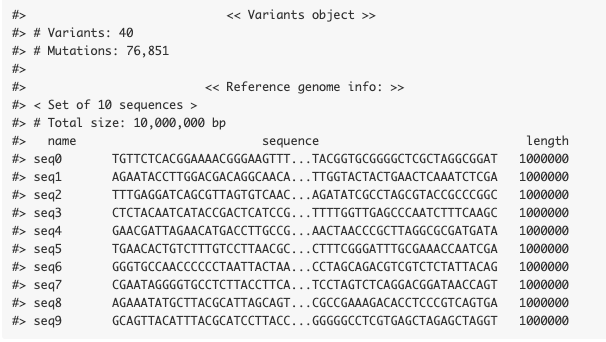
jackalope v0.1.2: Provides functions to simulate variants from reference genomes and read from both Illumina and Pacific Biosciences (PacBio) platforms. Simulating Illumina sequencing is based on ART by Huang et al. (2012). PacBio sequencing simulation is based on SimLoRD by Stöcker et al. (2016). There is an Introduction and a vignette on Models of nucleotide substitution.
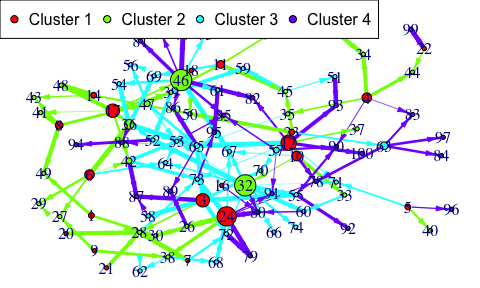
Patterns v1.0: Implements tools for deciphering biological networks with patterned heterogeneous measurements that enables joint modeling of genes and proteins. There is an Introduction and a vignette on Network Inference.
subgxe v0.9.0: Implements functions to combine multiple GWAS using gene environment interactions and p-value assisted subset testing (PASTA), as described in Yu et al. (2019). Get started with the vignette.
Marketing
mmetrics v0.2.0: Provides a mechanism for easy computation of marketing metrics. Default metrics include Click Through Rate, Conversion Rate, and Cost Per Click, but you can define your own metrics easily. See the vignette.
promotionImpact v0.1.2: Provides functions to analyze and measure the promotion effectiveness on a given target variable (e.g., daily sales). Effects of these variables controlled for trend/periodicity/structural change using prophet Taylor and Letham (2017). See the GitHub page for information.

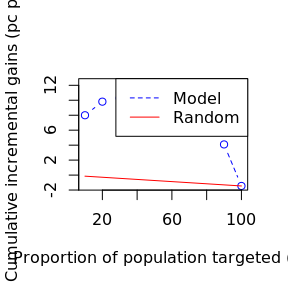
uplifteval Provides a variety of plots and metrics to evaluate uplift models including the R uplift package’s Qini metric and Qini plot. For background see Radcliffe (2007). There are vignettes on the plot_uplift_guelman(), plot_uplift(), and pl_plot() functions.
Machine Learning
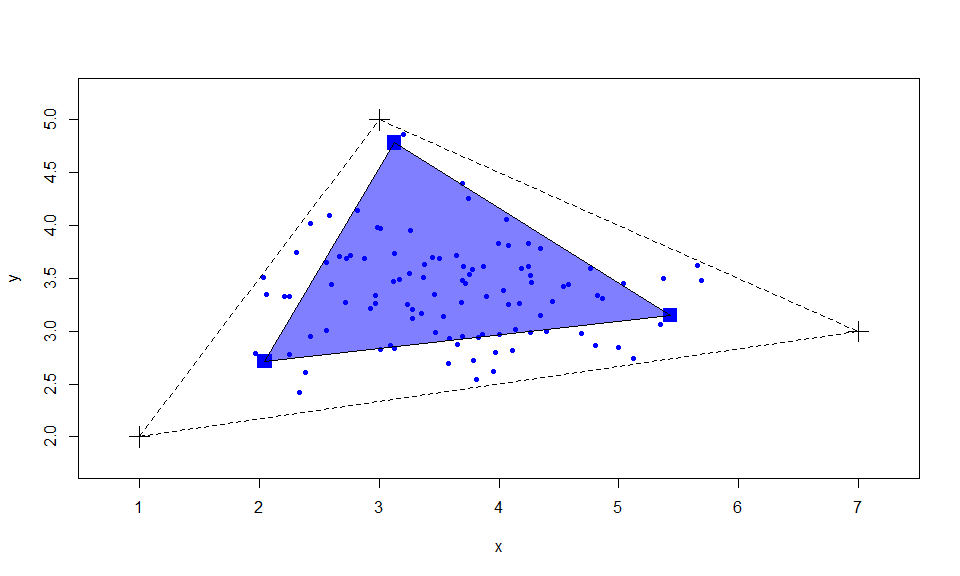
archetypal v1.0.0: Provides functions to perform archetypal analysis by using a convex hull approximation. See Morup and Hansen (2012), Hochbaum and Shmoys (1985), Eddy (1977), Barber et al. (1996), and Christopoulos (2016) for background information, and the vignette for an introduction.
googleCloudVisionR v0.1.0: Provides access to the Google Cloud Vision API in R. It is part of the cloudyr project.
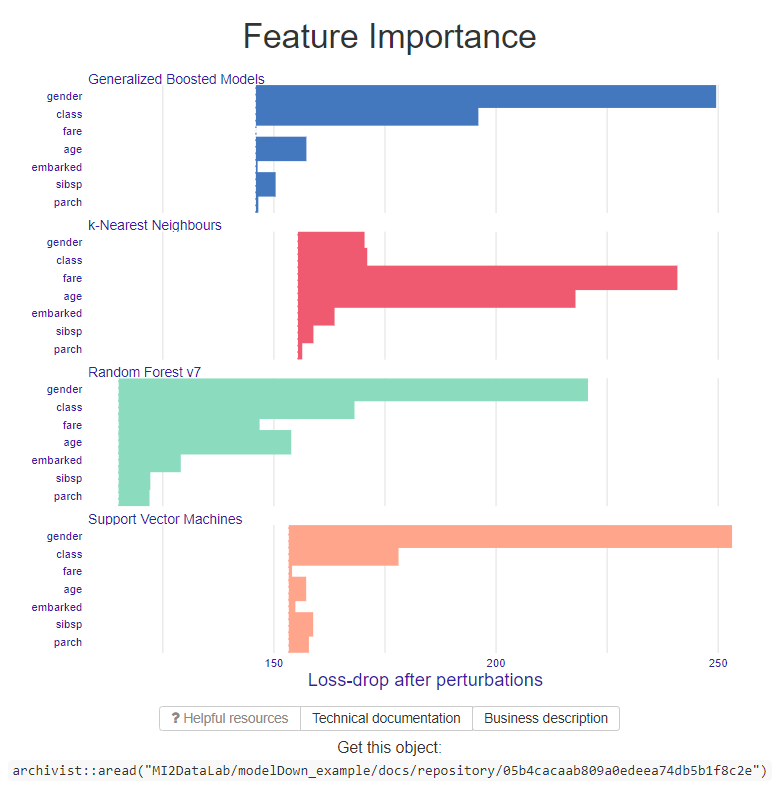
modelDown v1.0.1: Implements a website generator with HTML summaries for predictive models. This package uses DALEX explainers to describe global model behavior. See the GitHub page for getting started information and examples.
Science and Medicine
iCARH v2.0.0: Implements the integrative conditional autoregressive horseshoe model discussed in Jendoubi and Ebbels (2018). The vignette provides an example.
justifier v0.1.0: Implements a YAML-based standard for documenting justifications, such as for decisions taken during the planning, execution, and analysis of a study or during the development of a behavior change intervention. See Marques and Peters (2019) for background. There is an Introduction and vignettes on using justifier in behavior change intervention and in study design.
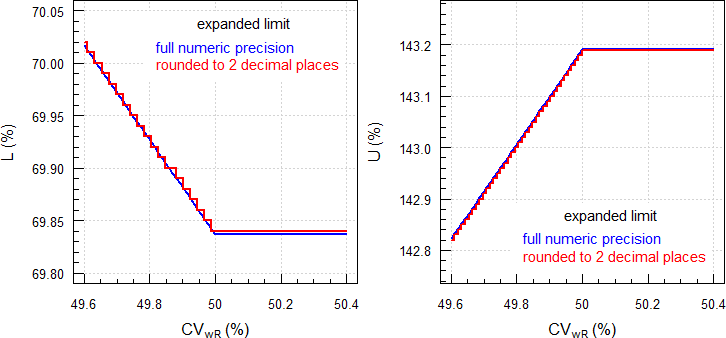
replicateBE v1.0.9: Implements comparative bioavailability-calculations for the EMA’s Average Bioequivalence with Expanding Limits (ABEL), and includes Method A and Method B detection of outliers. See the vignette.
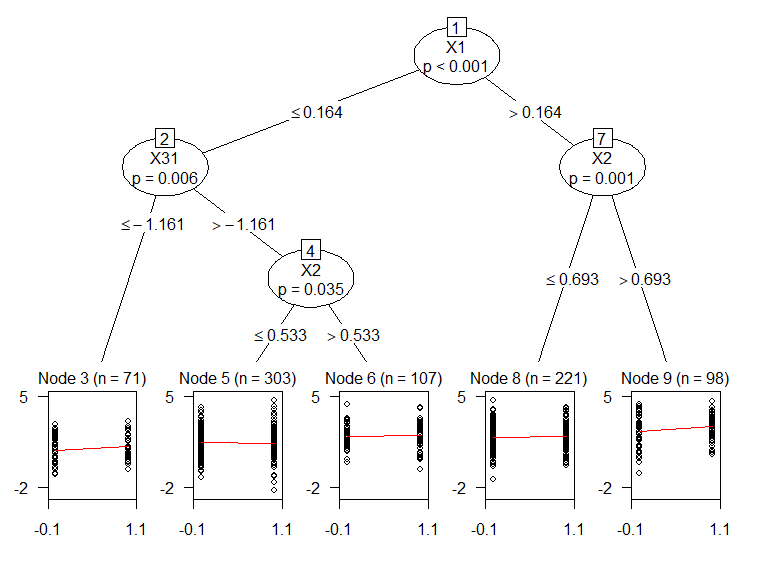
StratefiedMedicine v0.1.0: Provides analytic and visualization tools to aid in stratified and personalized medicine. Stratified medicine aims to find subgroups of patients with similar treatment effects, while personalized medicine aims to understand treatment effects at the individual level. There is an Introduction.
Statistics
cpsurvsim v1.1.0: Provides functions to simulate time-to-event data with type I right censoring using two methods: the inverse CDF method and a proposed memoryless method. See Rainer Walke (2010) for background and the vignette for the math.
durmod v1.1: Provides functions to estimate piecewise constant mixed proportional hazard competing risk models as described in Gaure et al. (2007), Heckman and Singer (1984), and Lindsay (1983). The vignette provides examples.
kernelPSI v1.0.0: Implements post-selection inference strategies for kernel selection, as described in Slim et al. (2019). See the vignette to get started.
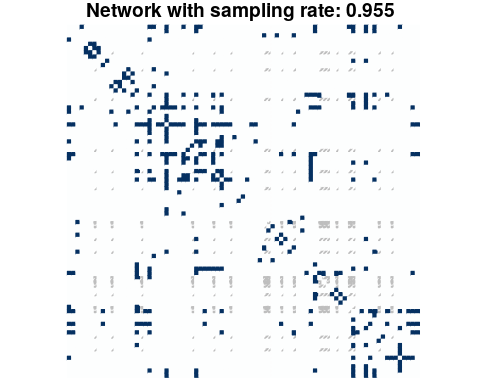
missSBM v0.2.0: Provides methods for handling missing data in stochastic block models. See Tabouy et al. (2019) for background and the vignette for a case study.
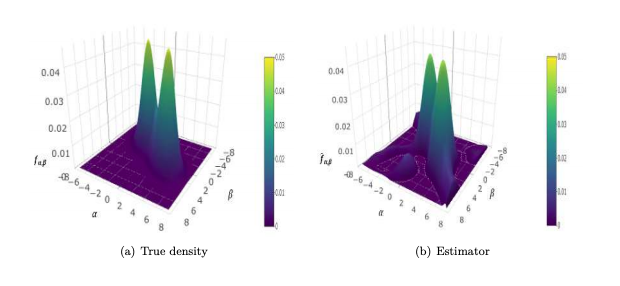
RandomCoefficients v0.0.2: Implement adaptive estimation of the joint density linear model where the coefficients, intercept, and slopes are random and independent from regressors. See Gaillac and Gautier (2019) for background information and the vignette for the theory and examples.
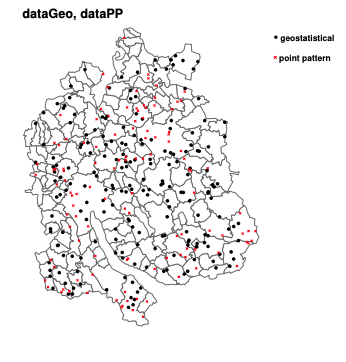
spatialfusion v0.6: Provides functions for multivariate modelling of geostatistical (point), lattice (areal), and point pattern data in a unifying spatial fusion framework. Details are given in Wang and Furrer (2019). Model inference is done using either Stan or INLA. See the vignette for examples.
ui v0.1.0: Implements functions to derive uncertainty intervals for (i) regression (linear and probit) parameters when outcomes are not missing at random (see Genbaeck et al. (2015) and Genbaeck et al. (2018)), and (ii) double robust and outcome regression estimators of average causal effects with possibly unobserved confounding (see Genbaeck and de Luna (2018)).
varclust v0.9.4: Provides functions to cluster quantitative variables, assuming that clusters lie in low-dimensional subspaces. Segmentation of variables, number of clusters, and their dimensions are selected based on BIC. There is a brief tutorial.
Time Series
bvartools v0.0.1: Implements some common functions used for Bayesian inference for mulitvariate time series models. There is an Introduction and vignettes on Bayesian Structural Vector Autoregression, Bayesian Error Correlation, and Stochastic Search Variable Selection.
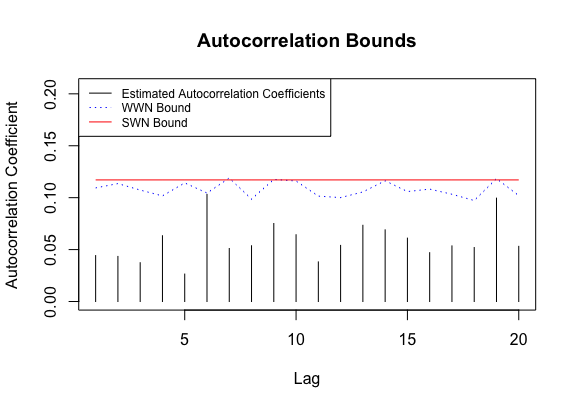
wwwntests v1.0.0: Provides an array of white noise hypothesis tests for functional data and related visualizations. Methods are described in Kokoszka et al. (2017), Characiejus and Rice (2019), and Gabrys and Kokoszka (2007). See the vignette for details.
Utilities
gargle v0.3.0: Provides utilities for working with Google APIs, including functions and classes for handling common credential types and for preparing, executing, and processing HTTP requests. There are vignettes on authentication, API Credentials, tokens, and helper functions.
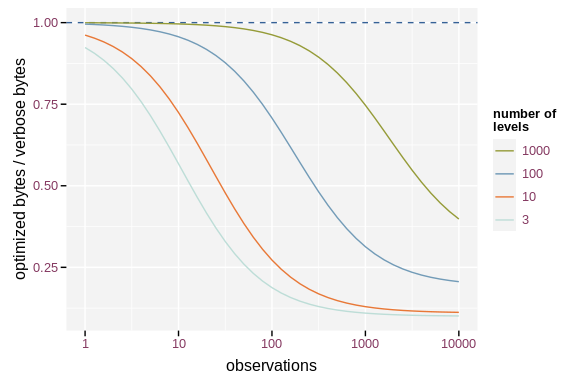
git2rdata v0.1: Provides functions to store and retrieve data frames in a Git repository, making versioning of data.frames easy and efficient using git repositories. There is a Getting Started Guide and vignettes on Efficiency, Optimizing Storage, and a Suggested Workflow.
metapost v1.0-6: Provides an interface to the MetaPost programming language. There are functions to generate an R description of a MetaPost curve, functions to generate MetaPost code from an R description, functions to process MetaPost code, and functions to read solved MetaPost paths back into R. Look here for different approaches for communicating between R and MetaPost.
rless Provides CSS preprocessor features using the LESS language, a CSS extension giving options to use variables, functions, or using operators while creating styles. See the vignette for examples.
rock v0.0.1: Implements the Reproducible Open Coding Kit, which was developed to facilitate reproducible and open coding, specifically geared towards qualitative research methods. See the Introduction for details.
tidyrules v0.1.0: Provides functions to convert a text-based summary of rule-based models to a tidy data frame (where each row represents a rule), with related metrics such as support, confidence, and lift. See the vignette for examples.
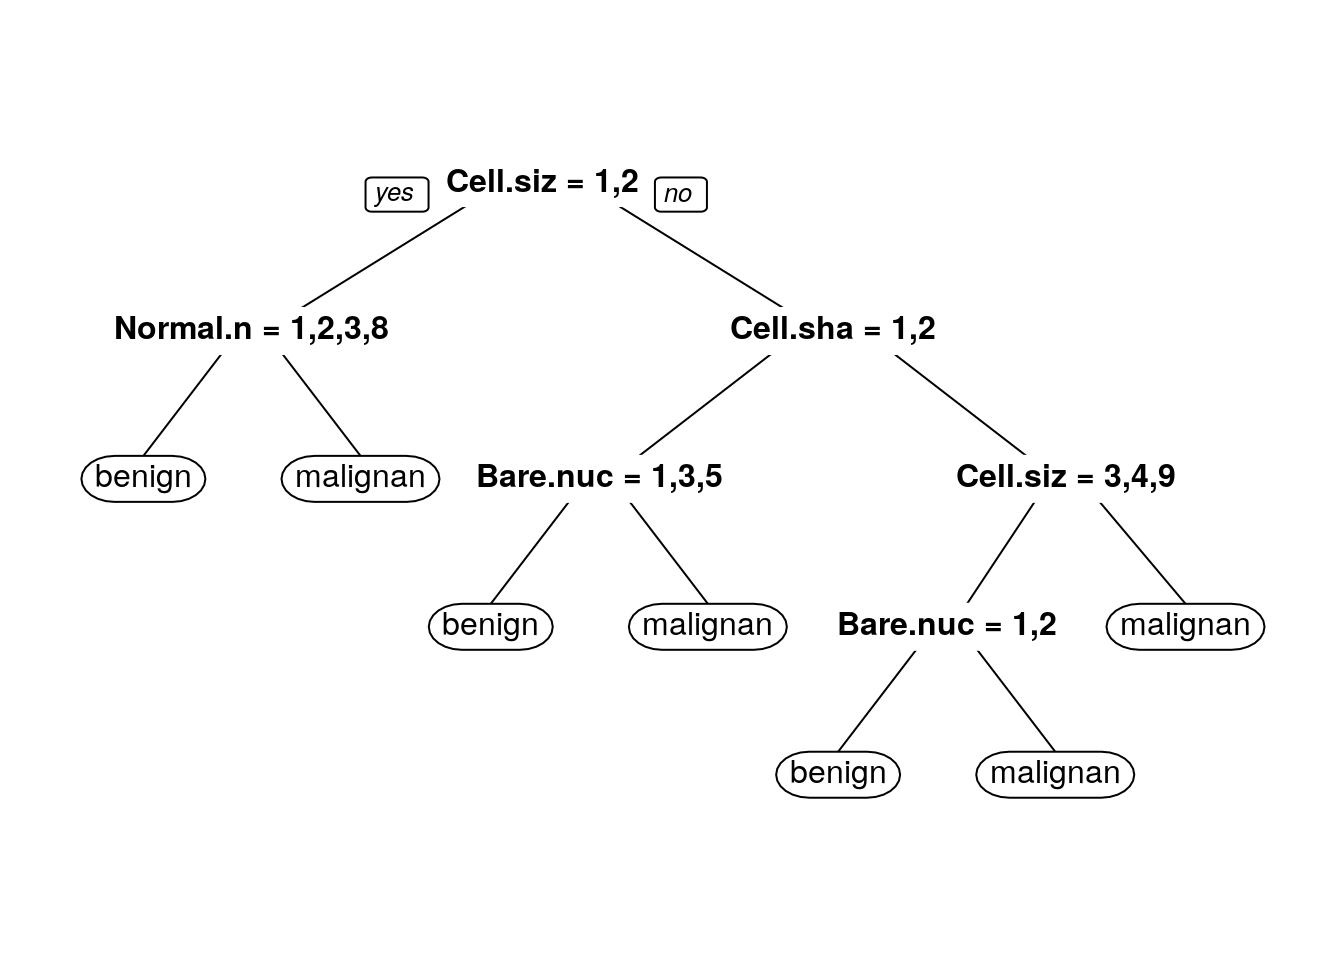
tsibbledata v0.1.0: Provides diverse data sets in the tsibble data structure, which are useful for learning and demonstrating how tidy temporal data can tidied, visualized, and forecasted. See README for an example.
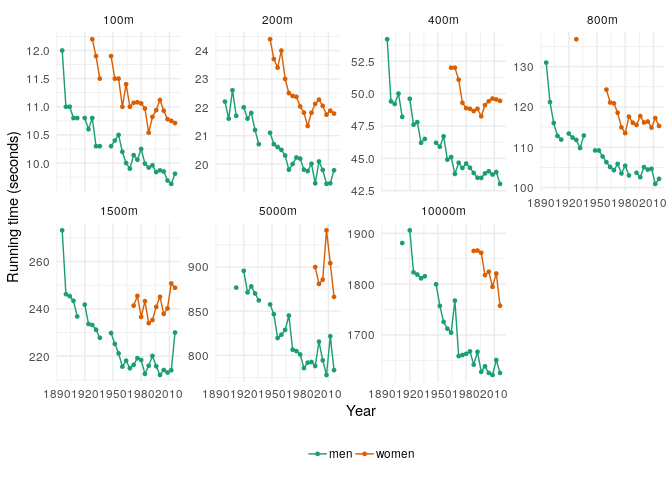
websocket v1.0.0: Implements a WebSocket client interface for R. WebSocket is a protocol for low-overhead real-time communication. There is an Overview vignette.
Visualization
basetheme v0.1.1: Provides functions to create and select graphical themes for the base plotting system. See README for the themes.
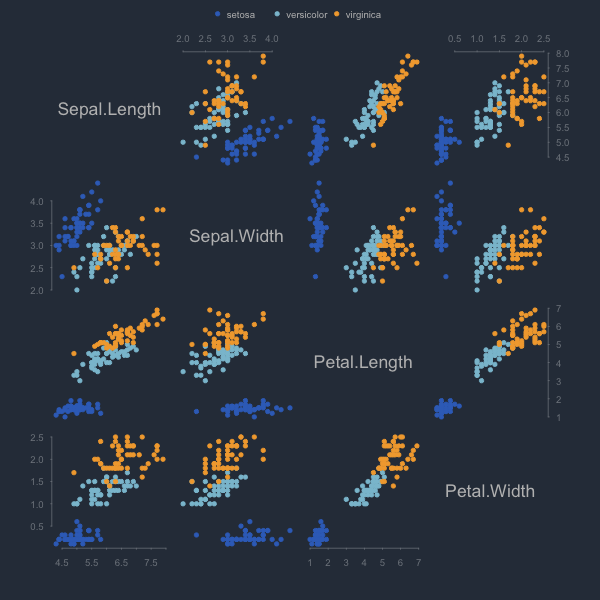
condvis2 v0.1.0: Extends the condvis package and Shiny app with interactive displays for conditional visualization of models, data, and density functions. See O’Connell et al. (2017) for the background. There is an Introduction and vignettes on Exploring keras models and Exploring model-based clustering.
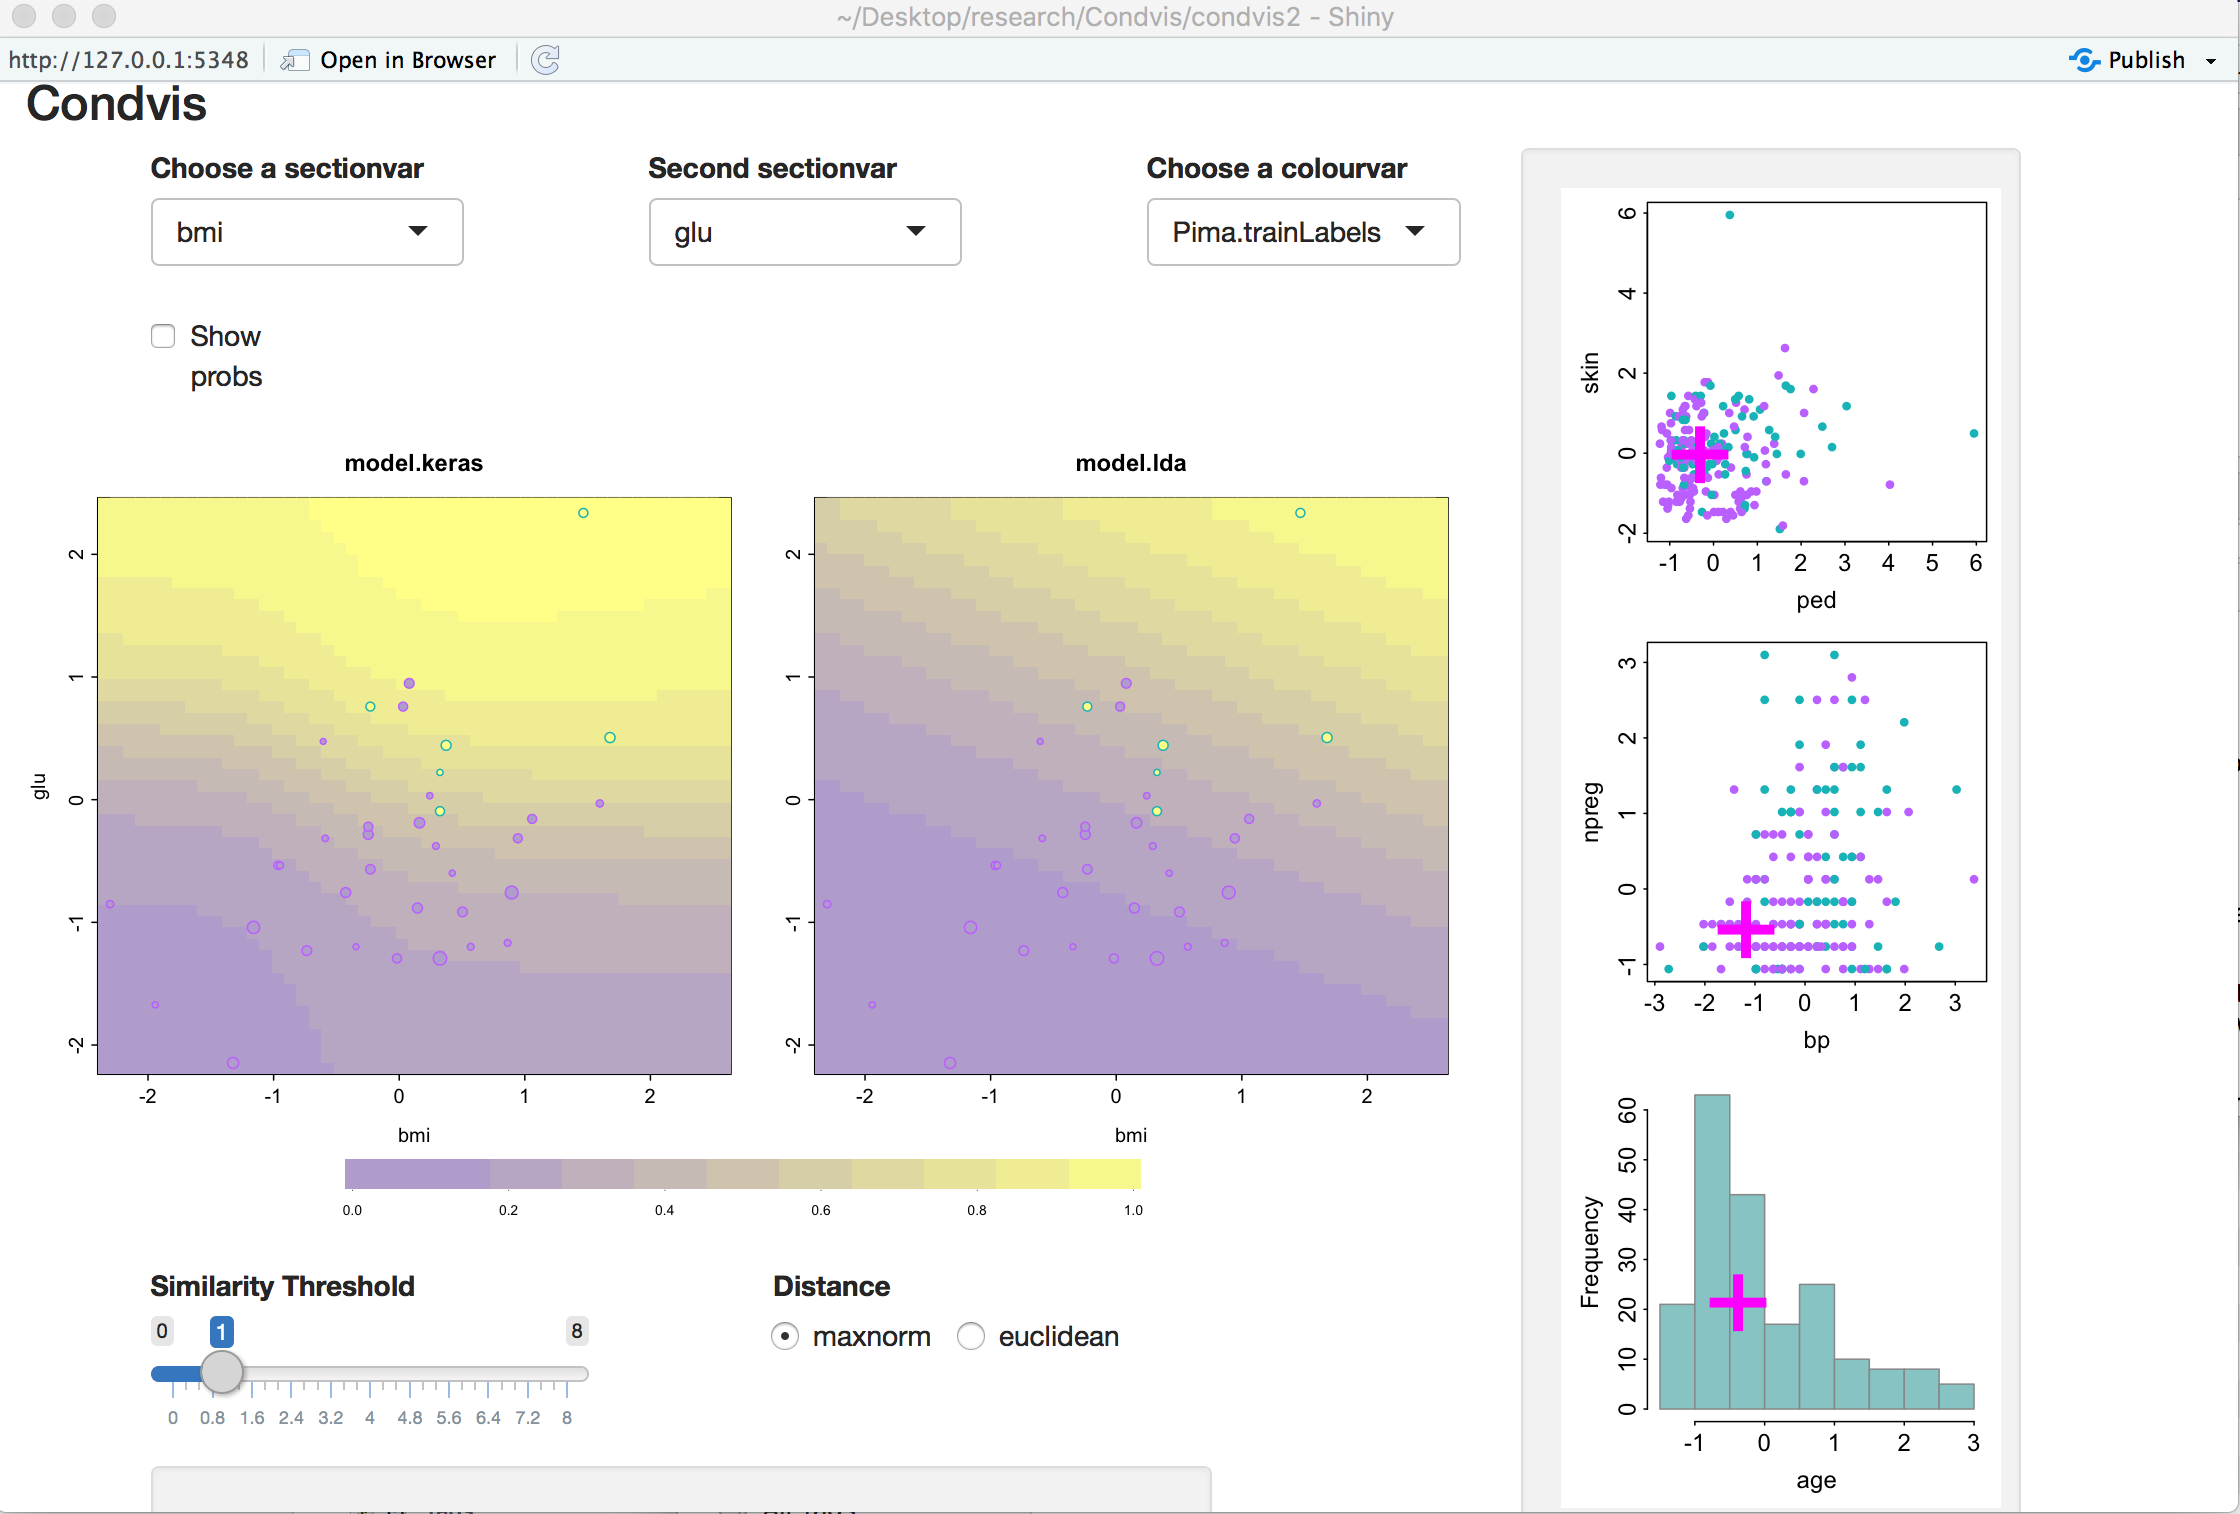
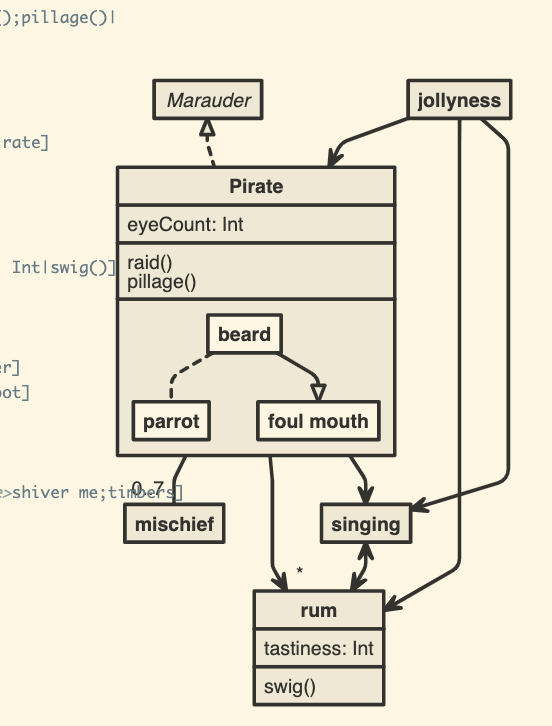
nomnoml v0.1.0: Implements a tool for drawing UML diagrams based on a simple syntax. See the README for examples, and look here for a demo.
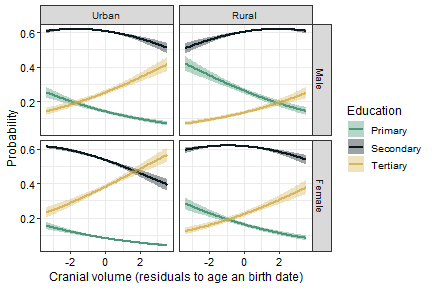
ormPlot v0.3.2: Extends the rms Regression Modeling Strategies package that facilitates plotting ordinal regression model predictions together with confidence intervals for each dependent variable level. The vignette provides examples.
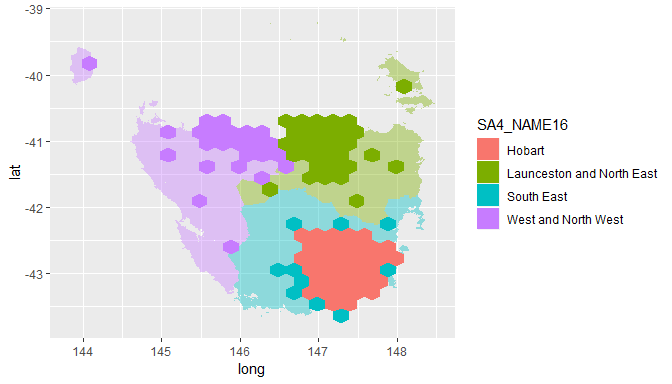
sugarbag v0.1.0: Provides functions to create a hexagon tilegram from spatial polygons. Developed to aid visualization and analysis of spatial distributions across Australia, which can be challenging due to the concentration of the population on the coast and the wide open interior of the country. There is a vignette pointing to ABS Data and another developing an example for Tasmania.
You may leave a comment below or discuss the post in the forum community.rstudio.com.